Geology Reference
In-Depth Information
3000
Mtoe
2500
2000
1500
1000
500
0
North America
S. & Cent.
America
Europe & Eurasia
Middle East
Africa
Asia Pacific
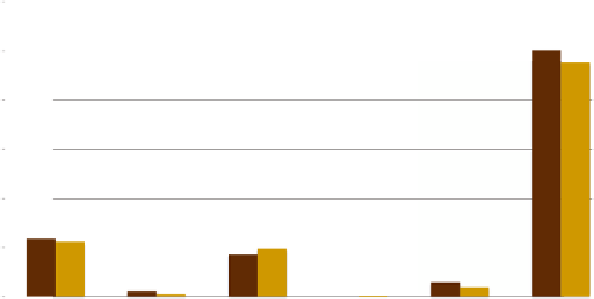
Coal: Production
Coal: Consumption
Fig. 6.6 Coal production and consumption at the end of 2010. Elaborated from data included in
BP (2011)
Table 6.5 Rank of oil according to the British standard BS2869:1998
Class rank
No. 1
No. 2
No. 4
No .5
No. 6
Density (kg/l)
0.824
0.864
0.927
0.952
1
Residual carbon (%)
Traces
Traces
2.5
5
12
Sulphur (%)
0.1
0.4-0.7
0.4-1.5
2.0 max.
2.8 max.
Oxygen and Nitrogen (%)
0.2
0.2
0.48
0.7
0.92
Hydrogen (%)
13.2
12.7
11.9
11.7
10.5
Carbon (%)
86.5
86.4
86.1
85.55
85.7
Water and sediments (%)
Traces
Traces
0.5 max.
1.0 max.
2.0 max.
Ashes (%)
Traces
Traces
0.02
0.05
0.08
HHV (kJ/kg)
46,365
45,509
43,920
43,353
42,467
Table 6.6 Physical properties of different compositions of natural gas (Botero, 2000)
Composition
Density
HHV
C
2
H
6
C
3
H
8
C
4
H
10
C
5
H
12
kg/Nm
3
kJ/Nm
3
CO
2
N
2
H
2
S CH
4
kJ/kg
5.5
-
7
77.7
5.5
2.4
1.18
0.63
0.9
39,575
43,915
3.51 32
0.5
52.5
3.7
2.2
2.02
3.44
1.06
32,600
30,750
26.2 0.7
-
59.2
13.9
-
-
-
1.08
31,668
29,261
0.17 87.7 -
10.5
1.6
-
-
-
1.14
5,073
2,552
0.2
0.6
-
99.2
-
-
-
-
0.72
37,524
52,126
-
0.6
-
-
79.4
20
-
-
1.41
72,176
51,079
-
0.5
-
-
21.8
77.7
-
-
1.77
89,110
50,049


Search WWH ::

Custom Search