Biomedical Engineering Reference
In-Depth Information
35
30
25
Aeration resumed
20
15
10
Aeration stopped
5
0
0
5
10
15
20
25
30
Time, h
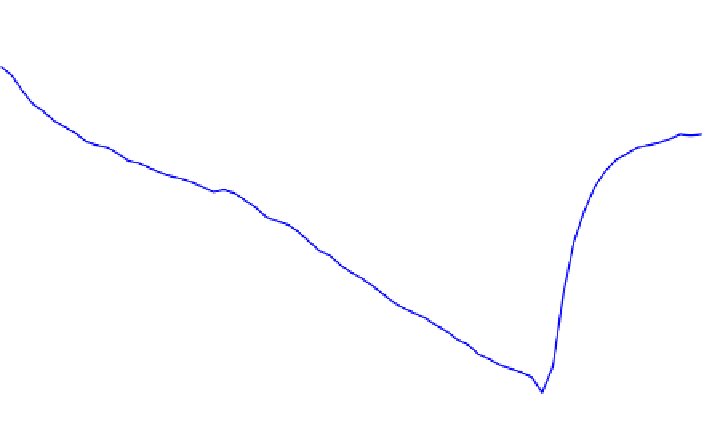
FIGURE 18.6
DO variation during the exponential growth period of Burkholderia cepacia in wood extract
hydrolysate, while aeration is changed in a 1.3 L bioflo 110 fermentor.
the cells causes the DO level to decrease steadily as there is no supply to make up the oxygen
consumption. The lowest value of C
L
must be above the critical O
2
concentration so
m
O
2
is
independent of C
L
. The relatively constant slope of DO decrease is an indication of constant
oxygen consumption rate. The descending curve is caused by the oxygen consumption, thus
the mass transfer can be decoupled. When air sparging is resumed, the DO increases due to
the mass transfer rate being higher the consumption rate. The ascending curve is a combina-
tion of mass transfer and consumption.
Once K
L
a is established, it can be used to estimate the rate of metabolic heat generation and
the total amount of cooling surface required. When oxygen is the rate-limiting step, the rate
of oxygen consumption is equal to the rate of oxygen transfer. If the maintenance require-
ment of O
2
is negligible compared to growth, then:
m
G
X
YF
X=
O
2
¼ K
L
aðC
C
L
Þ
(18.10)
or
m
G
X ¼ YF
X
=
O
2
K
L
aðC
C
L
Þ
(18.11)
The heat generated during microbial growth can be calculated using the heat of combustion
of the substrate and of cellular material. The heat of combustion of the substrate is equal to
the sum of the metabolic heat and heat of combustion of the cellular material.


Search WWH ::

Custom Search