Biomedical Engineering Reference
In-Depth Information
The maximum value of substrate concentration in the chemostat culture is the feed concen-
tration (prey washed out). Therefore, all washout condition is given by
D
m
b
max
S
0
K
b
þS
0
(16.94)
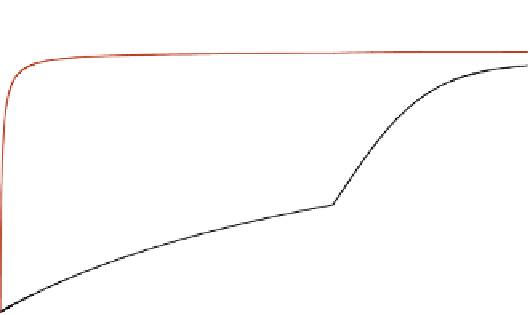
Fig. 16.22
shows the steady-state operating regions of the prey
e
predator system. Avariety
of types of dynamic coexistence behavior have been revealed by stability analysis for this
prey
e
predator interaction. When both prey and predator coexist in the reactor, there is no
stable solution as all the steady states are unstable. The trajectories to steady state are gov-
erned by
Eqns (16.87) through (16.89)
. The Eigen values of the Jacobian determine the nature
of the trajectories (
Fig. 16.11
); there are three Eigen values when both predator and prey are
present, or when
k
dp
þ
m
p
max
YF
b
=
S
S
0
K
p
þ
YF
b=S
S
0
D
<
(16.95)
The real Eigen value is positive. Therefore, there are no stable steady solutions. However, the
solutions are sustainable as there is a bound or limit on the variations.
16.6.5. LokkaeVolterra ModeldA Simplified PredatorePrey
Interaction Model
A classical model that describes oscillations in a prey
e
predator system is the
Lotka
e
Volterra model, which assumes K
b
S (substrate is unlimited) and K
p
[
X
b
(prey
population is very small). Eqns
(16.87) through (16.89)
are reduced to:
d
t
¼ m
0
b
X
b
m
0
p
X
b
X
p
d
X
b
(16.96)
YF
p=b
d
X
p
d
t
¼k
0
dp
X
p
þm
0
p
X
b
X
p
(16.97)
0.30
FIGURE 16.22
Steady-
state operating regions of
prey
e
predator model with
Monod growth. The kinetic
parameters are given by:
k
dp
¼
0,
m
pmax
¼
0.24/h, K
p
¼
4
10
11
E. coli/L,
m
bmax
¼
0.25/h, K
b
¼
5
10
4
g/L,
YF
p/b
¼
7.14
10
4
D.
discoideum/E. coli,YF
b/S
¼
3
10
12
E. coli/g.
Total washout
0.25
0.20
Predator washout
0.15
0.10
0.05
0.00
0.00
0.02
0.04
0.06
0.08
0.10
1
10
S
0
, g/L


Search WWH ::

Custom Search