Biomedical Engineering Reference
In-Depth Information
the dilution rate will vary slightly with time, and, in fact, the variation will show a bias.
Using an analysis more sophisticated than appropriate for this text, it can be demon-
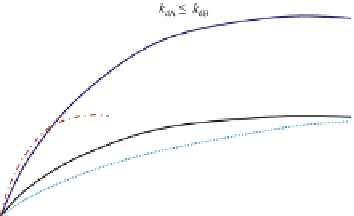
strated that one competitor will be excluded from the chemostat if the intensity of the
“noise” (random fluctuations) in D and the bias of the mean of D away from D
c
are
not both zero. Also, it is possible for either competitor to be excluded, depending on
how D varies.
Two competitors can coexist if we modify the conditions of the experiments. Examples of
such modifications include allowing spatial heterogeneity (the system is no longer well
mixed or wall growth is present) or another level of interaction is added (e.g. adding a pred-
ator or interchange of metabolites). Also, operation of the chemostat in a dynamic mode (D is
a function of time) can sometimes lead to coexistence. It is also interesting to note that the use
of other rate expressions (e.g. substrate inhibition) can lead to multiple crossover points and
potentially MSS.
Example 16-7.
Mixed cultures (more than one distinct microbial species) are common in
nature. Using two otherwise noninterfering species of different growth kinetics for feeding
on the same substrate as an example, discuss the continuous culturing (chemostat) outcome.
The two species are A and B. The kinetic relationships are
m
Amax
¼
1.5
m
Bmax
and K
SA
¼
3K
SB
.
The death rates are negligible to both species.
(a)
Is it possible to maintain both species A and B in the chemostat? Determine the
corresponding dilution rate.
(b)
For a given high substrate feed rate or dilution rate (see D
>
0.8
m
Bmax
), which species
would survive?
(c)
For a given low substrate feed rate (see D
<
0.6
m
Bmax
), which species would survive?
(d)
Is the solution in a) sustainable?
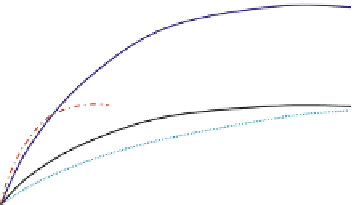
Solution.
The two species have different growth rates. At high substrate concentrations,
species A grows faster than species B. However, at low-substrate concentrations, species B
could grow faster than species A because of its much lower saturation constant.
Fig. E16-7
shows a sketch of the growth kinetics in a chemostat.
(a)
(b)
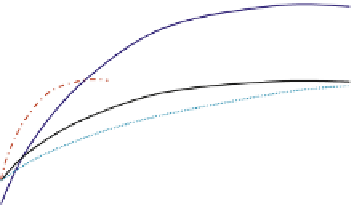
FIGURE 16.19
m
net
S relationship for two competing species (A and B) in a mixed culture. (a)
m
Amax
> m
Bmax
and k
dA
k
dB
(b)
m
Amax
> m
Bmax
and k
dA
>
k
dB


Search WWH ::

Custom Search