Biomedical Engineering Reference
In-Depth Information
(a)
(b)
(c)
x
2
x
2
x
2
f
2
= 0
f
2
= 0
f
2
= 0
x
20
x
20
x
20
f
1
= 0
f
1
= 0
x
1
x
1
x
1
0
0
0
0
0
0
x
10
x
10
x
10
f
1
= 0
(d)
x
2
(e)
x
2
f
2
= 0
f
2
= 0
x
20
x
20
x
1
x
1
0
0
0
0
x
10
x
10
f
1
= 0
f
1
= 0
x
2
x
2
x
2
(f)
(g)
(h)
f
2
= 0
f
2
= 0
f
2
= 0
x
20
x
20
x
20
x
1
x
1
x
1
0
0
0
0
0
0
x
10
x
10
x
10
f
1
= 0
f
1
= 0
f
1
= 0
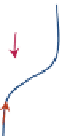
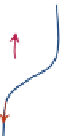
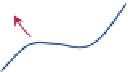
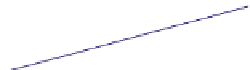
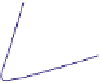
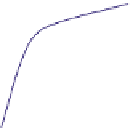
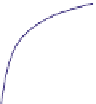
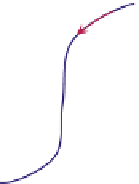
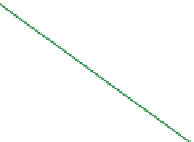
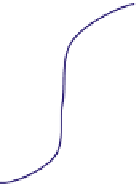
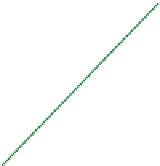
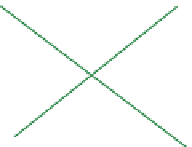
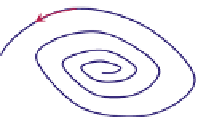
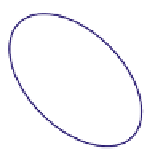
FIGURE 16.11
Schematics of trajectories to steady state solution for differential equations with different Eigen
values. While systems (a), (d), (f), and (h) are sustainable, only (a), (d), and (f) are strictly stable.
However, the feed was unexpectedly diluted to S
0
¼
60 g/L while all other operating param-
eters remained identical. Determine
(a)
The new steady-state solutions;
(b)
Which steady state is achieved when the system is left alone for a long time? How long
that time is if both the substrate and the biomass concentrations are within 99% of the
final steady state?
(c)
Plot out the trajectory of b) on (S, X) plane.


Search WWH ::

Custom Search