Biomedical Engineering Reference
In-Depth Information
1.0
Extinction:
T
0
= 554.10 K
0.8
0.6
0.4
0.2
Ignition:
T
0
= 581.12 K
0.0
500
520
540
560
580
600
620
640
T
0
, K
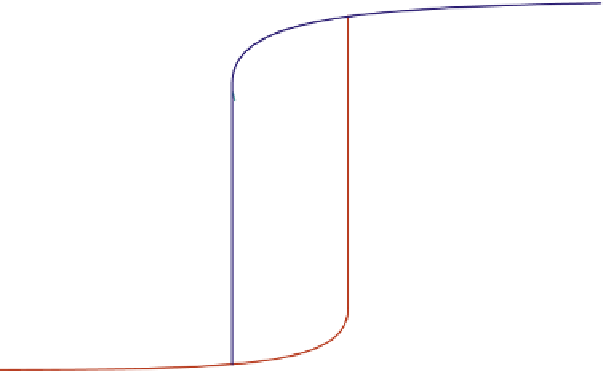
FIGURE E16-3.2
Ignitionextinction curve.
Fig. E16-3.2
shows the change in conversion achieved while varying the feed temperature.
As one increases the feed temperature T
0
from 250
C (523.15 K), the conversion f
A
obtained
increases very slowly, until the feed temperature reaches 581.12 K (or 307.97
C) a slight
increase in feed temperature will result in a sudden jump in the conversion f
A
from 16.7%
to over 95.58%. We call this feed temperature the ignition temperature. Further increase in
feed temperature only results in slight increase in conversion.
On the other hand, if one decreases the feed temperature T
0
from 375
C (648.15 K), the
conversion f
A
obtained decreases very slowly, until the feed temperature lowers to
554.10 K (or 280.95
C) a slight decrease in feed temperature will result in a sudden drop
in the conversion f
A
from 77.5% to 16.47%. The reaction is quenched. We call this feed temper-
ature the extinction temperature. Further decrease in feed temperature only results in slight
decrease in conversion.
16.3. APPROACHING STEADY STATE
When the reactor-operating conditions are set, the concentration(s) and temperature
approach to steady state as governed by
Eqns (16.11) and (16.19)
. These are a set of differen-
tial equations that must be solved simultaneously. Instead of examining a particular problem,
let us look at the stability from a mathematical point of view. Let us choose a set of differential
equations:
d
t
¼ fðxÞ¼AxþB
d
(16.25)


Search WWH ::

Custom Search