Biomedical Engineering Reference
In-Depth Information
Now that we derived at an equation for the cell maintenance, we can observe that the cell
maintenance may not be a constant nor it would be a straight line when correlated with the
cell growth rate. When a straight line is forced upon the cell maintenance needs, one can
expect both the slope (proportionality constant) and the intercept (or the constant “apparent”
maintenance coefficient) to vary depending on the range of data collected.
To illustrate the importance of the variable endogenous metabolism with cell growth, we
examine the data collected by Benthin et al. (S. Benthin, U. Schulze, J. Nielsen, J. Vlladsen.
1994. Growth energetics of Lactococcus cremoris FD1 during energy-, carbon-, and nitrogen-
limitation in steady state and transient cultures. Chem. Eng. Sci. 49: 589
e
609), who con-
ducted an analysis of the cell growth and product formation of Lactococcus cremoris (part of
the results are shown in
Table 11.2
).
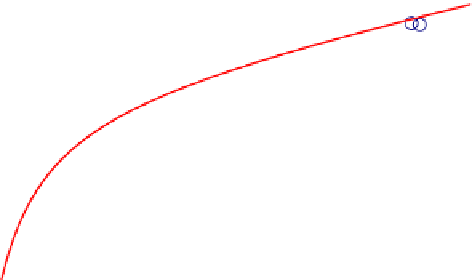
Figure 11.5
shows the specific production rate
m
P
versus
the specific growth rate
m
G
from a batch fermentation of L. cremoris. The medium contained
20 g/L of glucose and 7 g/L of a complex N source (a mixture of 50% yeast extract and 50%
caseine peptone). The biomass concentration was monitored by flow injection analysis, and
the specific total acid production was measured by monitoring the amount of alkali added to
keep the pH constant in the bioreactor. Throughout the batch fermentation, the glucose
concentration was high, and consequently only lactic acid was produced.
The lactic acid production is closely correlated to the ATP production (1 mole of ATP per
mole of lactic acid produced), and
Fig. 11.5
can therefore be used to estimate YF
X/ATP
and
m
eATP
based on
Eqns (11.25) and (11.36)
. That is,
m
e
m
max
m
G
K
e
m
þ m
G
m
ATP
¼
YF
ATP
=X
ðm
G
þ m
e
Þ¼
YF
ATP
=X
m
G
þ
(11.37)
The
line plotted is with YF
ATP/X
¼
1.216 g-lactic
acid/g-cells
¼
13.5 mmol/g-cells;
1.521 h
1
; and K
e
m
¼
0.083 h
1
.
m
e
m
max
¼
30
25
20
15
10
5
0
0.0
0.1
0.2
0.3
0.4
0.5
0.6
0.7
0.8
FIGURE 11.5
Specific product (acids) formation rate as a function of growth rate for Lactococcus cremoris in
a complex medium containing 20 g/L glucose and 7 g/L nitrogen source. Data source: S. Benthin, U. Schulze, J.
Nielsen, J. Vlladsen. 1994. Growth energetics of Lactococcus cremoris FD1 during energy-, carbon-, and nitrogen-limitation
in steady state and transient cultures. Chem. Eng. Sci. 49: 589
e
609.


Search WWH ::

Custom Search