Biomedical Engineering Reference
In-Depth Information
1.4
ExLan
UniLan
Temkin
Freundlich, for
K
A
C
A
= (0, 1)
Temkin, correlation for
K
A
C
A
= (0.1,
10
)
1.2
1.0
0.8
0.6
0.4
0.2
0.0
0
0
1
1
K
A
C
A
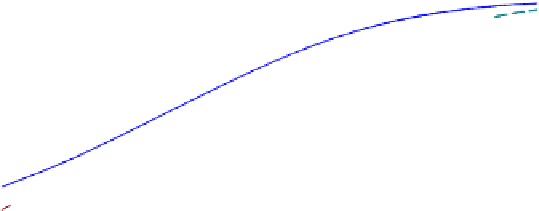
FIGURE 9.7
Approximation of UniLan isotherm by Temkin and Freundlich isotherms, and comparison with
ExLan isotherm having the same parameter:
E
max
¼
5
RT
. Freundlich isotherm were correlated for
K
A
C
A
˛
(0, 1):
0.9
12
8(
K
A
C
A
)
0.2636
, and the Temkin isotherm correlation is for
K
A
C
A
804
1
q
A
¼
˛
(0.1, 10):
q
A
¼
10
:
ln
14212K
A
C
A
e
10:804
ð
0
:
Þ.
Therefore, we can fit the experimental data with
Eqn (9.43)
to check if the model can reason-
ably describe the experimental data. Since the power-lawmodel is not valid at high coverages,
we performed the least square fits on spreadsheet program either with the highest coverage
point removed or kept. The solutions are illustrated in
Tables E9-2.1
and
E9-2.2
.
TABLE E9-2.1
Least Square Parameter Estimation for the Freundlich Isotherm. The Final Solution Shown
Are for c
0
¼
55.85 (mg/L)
m
0.271, Which Were
Obtained by Minimizing the Variance between the Freundlich Model and the Experimental
Data, s
L
, While Changing c
0
and m
$mg-phenol/g-Activated Carbon and m
¼
Error
2
(
Aqueous solution
C
A
, mg/L
On activated carbon
C
0
As
, mg/g
Eqn
(9.43)
C
As
, mg/g
C
As
LC
0
As
)
2
0
0
0
0
1.5
53.0
62.33299
87.10465
2.0
62.4
67.38618
24.86198
5.1
82.8
86.8411
16.33046
6.6
105.0
93.12478
141.0209
22.9
137.0
130.4549
42.83818
51.6
172.2
162.5764
92.61345
80.2
170.9
183.2113
151.5683
s
P
8
i ¼
2
ðC
As;i
C
0
As;i
Þ
1
s
L
¼
¼
8.914979
8
1


Search WWH ::

Custom Search