Biomedical Engineering Reference
In-Depth Information
(a)
(b)
10
1.0
9
0.9
8
0.8
7
0.7
6
0.6
C
S
C
E
5
0.5
4
0.4
C
SE
3
0.3
C
P
2
0.2
C
PE
1
0.1
0
0.0
0
10
20
30
40
50
0
10
20
30
40
50
k
c
t
k
c
t
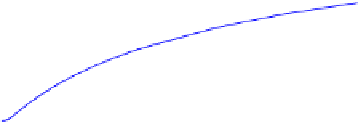
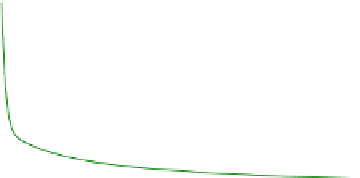
FIGURE 8.24
Variations of free substrate and product concentrations (a) and enzyme distributions (b) with time
for k
1
C
E0
¼
0.1 k
c
; K
S
¼
1/C
E0
; K
C
¼
5; K
P
¼
0.5/C
E0
; and k
3
C
E0
¼
k
c
.
We first examine a case where the catalytic reaction rate is limiting. For this case, we scale
the time with the catalytic reaction rate constant. The solutions for C
S0
¼
10 C
E0
; k
1
C
E0
¼
10k
c
;
K
S
¼
10 k
c
are shown in
Fig. 8.22
. One can observe
that in the batch operation, the free substrate concentration (
Fig. 8.22a
) experiences a quick
drop before the free product in the reaction mixture is observed. The decrease is simply
due to the complexing of substrate with enzyme and thus is dependent on the amount of
enzyme or total enzyme activity. Since the product P is also associated with enzyme, the frac-
tion of enzyme associated with substrate S increases sharply at the start (
Fig. 8.22b and d
),
reaches a maximum, and then decreases, as the product P is being formed. The fraction of
enzyme associated with product P increases with time, and as more product P is formed,
it also discharged to the reaction mixture and causes the concentration of free product P to
increase. The concentration of free product shows almost a delay initially before graduate
increase with time (
Fig. 8.22a and c
).
In the second case, we examine the situation where the uptake of substrate or asso-
ciation of substrate S with enzyme and catalytic reaction are of the similar rates, but
the discharge of product from the enzyme is fast. The results are shown in
Fig. 8.23
.
One can observe that there is a drop in the concentration of free substrate S initially,
but the drop is gradually at the time scale of reaction (
Fig. 8.23a and b
). C
SE
reached maxi-
mum gradually and not as obvious as compared
Fig. 8.23
cwith
Fig. 8.23
b. After C
SE
reached maximum, and the fraction of free enzyme become “steady” at about k
c
t
1/C
E0
; K
C
¼
5; K
P
¼
0.5/C
E0
; and k
3
C
E0
¼
¼
0.25
(
Fig. 8.23
d).
We then examine the case when uptake of substrate S is the rate-limiting step as shown
in
Fig. 8.24
. In this case, the decrease in C
S
initially is not as apparent in the time scale
of reaction (and as the previous two cases). The increase in the concentration of free
product P showed almost a “delay.” Therefore, the effect of substrate uptake rate is still
important.
The effects of the amount of enzyme, substrate, and product saturation constants are
important if there are significant amount of enzyme being added to a batch system.


Search WWH ::

Custom Search