Biomedical Engineering Reference
In-Depth Information
Notice that this is the same relationship that we initially wrote down empirically from the
inspection of the scatter diagram in
Fig. 7.1
. The variance of
Y
for a given
x
is
VðYjxÞ¼Vða
0
þ a
1
x þ
ε
Þ¼Vða
0
þ a
1
xÞþVð
ε
Þ¼s
2
(7.4)
Thus, the true (regression) model
E
(
Y
a
1
x
is a line of mean values for the experi-
mental data; that is, the height of the regression line at any value of
x
is just the expected
value of
Y
for that
x
. The slope,
a
1
, can be interpreted as the change in the mean of
Y
for
a unit change in
x
. Furthermore, the variability of
Y
at a particular value of
x
is determined
by the error variance
j
x
)
¼
a
0
þ
2
. This implies that there is a distribution of
Y
-values at each
x
and that
the variance of this distribution is the same at each
x
.
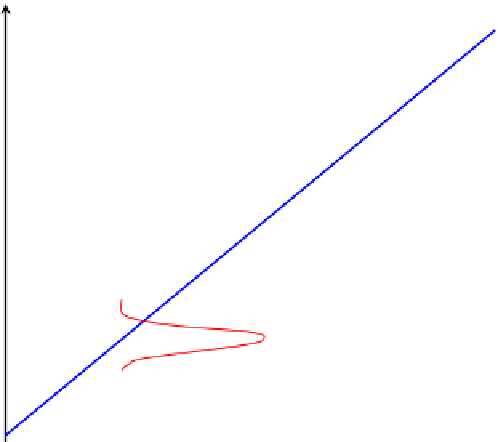
For example, suppose that the true regression model relating water flow rate to rotameter
reading is
y
s
2
0.001554.
Figure 7.2
illustrates this situation. The solid line represents the mean value of
Y
(or the value of
y
)
and the dashed curves represent the probability (the horizontal distance to the base dashed
line:
x
¼
0.0661
þ
0.05842
x
and suppose that the variance is
s
¼
x
2
) at which
Y
is observed. Notice that we have used a normal distribution
to describe the random variation in
¼
x
1
or
x
¼
a
1
x
(the mean) and
a normally distributed random variable,
Y
is a normally distributed random variable. The
variance
. Since
Y
is the sum of a constant
a
0
þ
ε
2
determines the variability in the observations
Y
on water flow rate. Thus,
s
2
2
when
s
is small, the observed values of
Y
will fall close to the line, and when
s
is large,
2
the observed values of
Y
may deviate considerably from the line. Because
s
is constant,
the variability in
Y
at any value of
x
is the same.
The regression model describes the relationship between water flow rate
Y
and rotameter
reading
x
. Thus, for any value of rotameter reading, water flow rate has a normal distribution
y
y
2
= a
0
+ a
1
x
2
y = a
0
+ a
1
x
y
1
= a
0
+ a
1
x
1
x
2
x
1
x
FIGURE 7.2
The distribution of
Y
for a given value of
x
.


Search WWH ::

Custom Search