Biomedical Engineering Reference
In-Depth Information
5.11. GRAPHIC SOLUTIONS USING BATCH
CONCENTRATION DATA
We have learned so far how to perform reactor analysis for flow reactors based on known
reaction rate. The reaction rate is usually experimentally determined via examining the
concentration changes in a batch reactor, which will be discussed in Chapter 7. In this section,
we shall examine how to design or analyze a flow reactor based on the concentration profile
obtained in batch experiments at the same (feed) conditions.
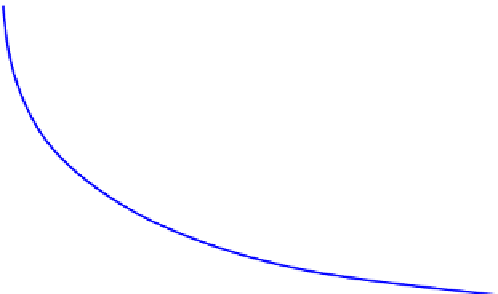
Figure 5.21
shows a typical (reactant) concentration profile obtained in a batch reactor.
Initially, the reactor is charged with the raw material with the key reactant concentration
of
C
A0
. As the reaction progresses, the concentration of A decreases with time until the reac-
tion is complete. If we look at a key product, the concentration would be increased with
increase duration of the reaction, just opposite to the reactant concentration. For ease of
discussion, we shall restrict ourself to constant density reactions, for example, condensed
phase (liquid and/or solid) reactions.
5.11.1. Solution of a PFR using Batch Concentration Data
For a reaction carried out in a steady PFR, we have learned that mole balance in a differ-
ential volume of the PFR leads to
d
F
j
d
V
r
j
¼
(5.11)
where
F
j
¼ QC
j
(5.105)
For constant density reactions, the volumetric flow rate
Q
is constant throughout the
reactor. Therefore,
Eqns (5.11) and (5.105)
lead to
d
C
j
r
j
d
V
Q
¼
(5.106)
C
A0
C
A
C
Ae
0
t
t
e
0
t
FIGURE 5.21
Variation of concentration with reaction time in a batch reactor.


Search WWH ::

Custom Search