Biomedical Engineering Reference
In-Depth Information
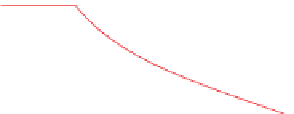
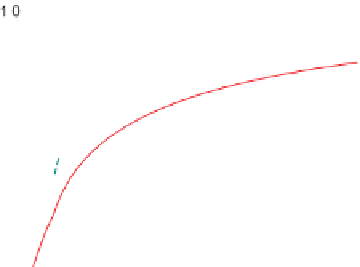
FIGURE E5-10
Optimum temperature progression in a PFR and its effect on conversion. (a) Optimum
temperature progression as a function of conversion in the PFR. (b) Optimum temperature progression along the
PFR. (c) Conversion at optimum reactor temperature as a function of PFR size. (d) Heat generation of removal
needed along the PFR.
Noting that
F
A
¼
F
A0
(1
f
A
)
¼
Q
0
C
A0
(1
f
A
),
Eqn (E5-10.11)
can be rendered to give
r
d
s
¼ C
A
0
d
f
A
¼ 0
(E5-10.12)
At reactor inlet,
f
A
¼
0,
T
¼
T
0
¼
523.15 K:
50 10
5
8:314 623:15
P
RT
0
¼
m
3
m
3
C
A
0
¼
mol
=
¼ 965:089
mol
=
Integrating
Eqn (5-10.12)
yield,
f
Ae
f
Ae
s
¼ C
A
0
Z
r
¼ C
A
0
Z
d
f
A
d
f
A
(E5-10.13)
f
A
1 þ f
A
2
k
f
P
1
f
A
1 þ f
A
k
b
P
2
0
0


Search WWH ::

Custom Search