Geoscience Reference
In-Depth Information
80
(a)
70
60
50
40
30
20
10
0
110
100 0 0 0 0 0 0 0 0 0
1365 ±35yr BP
225 ± 30yr BP
present
vegetation
CLQ
CLC
20% of maximum
mean
80
(b)
70
60
50
40
30
20
10
0
70
60
50
40
depth (cm)
30
20
10
4940±100 yr BP
1280 ±25 yr BP
present
vegetation
CLQ
CLC
20% of maximum
mean
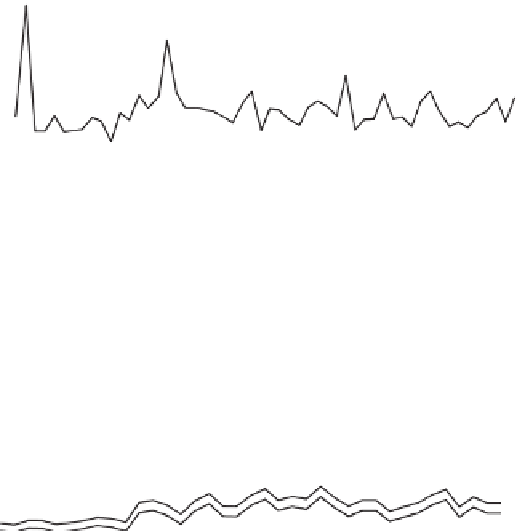
Figure 2.4
Estimates of woody vegetation cover: (a) over the past c. 1,400 years at Mafayeni and (b) over
the past c. 4,900 years at Malahlapanga, based on fossil pollen data. The 95% confidence limits are
shown for quadratic regression alone (CLQ) and for the quadratic regression and pollen data combined
(CLC). The mean estimated woody vegetation cover and threshold of potential concern (20% of the max-
imum estimated woody vegetation) cover are also shown (Gillson and Duffin 2007).
reveal more variability (Jackson 2006, Jackson and Hobbs 2009), suggesting that 'highest
ever' is a problematic benchmark, and that a deviation from the mean or a change in the
coefficient of variation may prove a more useful TPC (Gillson and Duffin 2007). Furthermore,
the various sites analysed in the Park showed significant differences in variability and max-
imum tree cover, suggesting that local TPCs might be needed. The palaeoecological work also
showed that some wooded savannas occurred on sites that had previously been grasslands,
and that this transition was unlikely to reverse (Gillson and Ekblom 2009a). For example, the
pollen, charcoal, and stable isotope data from Malahlapanga in the Kruger National Park,
indicated a potentially irreversible shift from a grazing lawn to a fire and rainfall driven


Search WWH ::

Custom Search