Geoscience Reference
In-Depth Information
(a)
(b)
100
16 000 000
(c)
(d)
90
14 400 000
N
80
12 800 000
50 km
70
11 200 000
60
9 600 000
50
8 000 000
40
6 400 000
30
4 800 000
50
20
3 200 000
Percent Grass and
Weed Pollen
New England
Population
25
10
1 600 000
Time Period
0
0
average presettlement
peak postsettlement
most recent
1600
1650
1700
1750
1800
Year
1850
1900
1950
2000
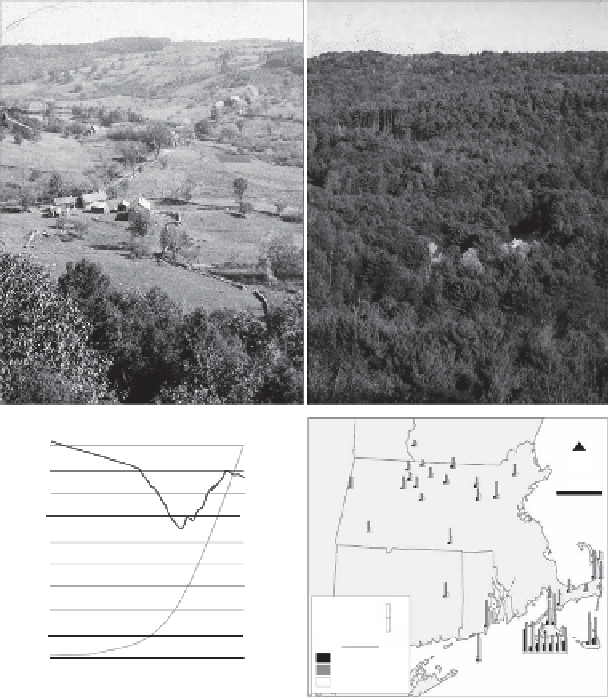
Figure 7.6
Changes in forest cover in New England. Swift River valley in (a) 1880s (Photo credit: Harvard
Forest Archives, Harvard University), (b) 2010 (Photo credit: David Foster, Harvard Forest Archives,
Harvard University). (c) Changes in New England forest cover and human population since 1600, show-
ing the reforestation of abandoned farmland (redrawn from Foster et al. (2010). (d) Fossil pollen data
showing the percentage of grass and weed pollen, indicating open areas, prior to European settlement,
peak post-settlement, and in the late twentieth century (Motzkin and Foster 2002). Reproduced with
permission from John Wiley & Sons.
white pine and red maple, while fire-tolerant pitch pine and white oak have declined. Chest-
nut blight, gypsy moth, beech bark disease, and hemlock woolly adelgid have selectively
attacked various tree species over time, altering their dominance and abundance in the for-
ests. A number of fire-dependent habitats such as pine barren and pitch pine (
Pinus rigida
)/
oak communities have declined as a result of fire suppression (North and Keeton 2008, Long
2009). Some forest types like old field pine stands are transient successional stages and will
only persist if a forest management maintains a dynamic mosaic of stands at different succes-
sional stages.
Search WWH ::

Custom Search