Geoscience Reference
In-Depth Information
(a)
(b)
1,900
3,000,000
1,700
Number of
Settlements
2,500,000
1,500
1,300
2,000,000
Natural
Capital
1,100
900
1,500,000
700
1,000,000
500
Largest
Cluster Size
300
500,000
100
-100
0
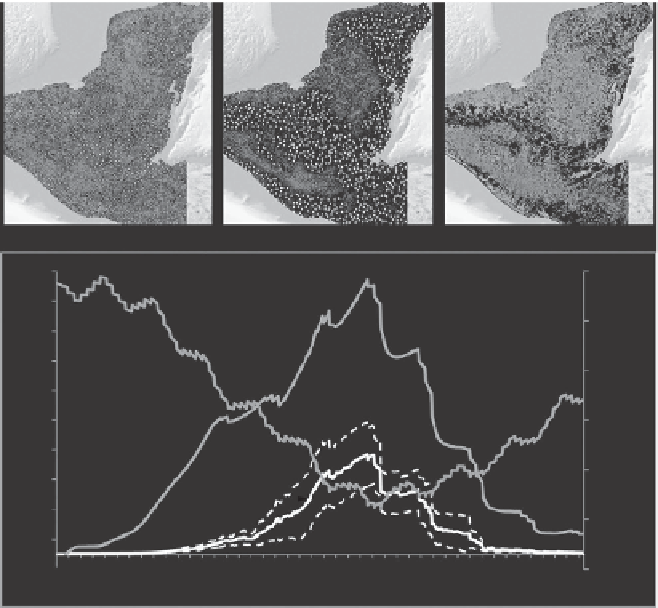
Fig u re 7.3
(a) Changes in ecosystem services at three different time periods, as simulated by MayaSim.
Darker colour shows increased ecosystem services. (b) Total number of settlement nodes and number of
nodes within the largest cluster (primary axis), and total natural capital (total sum of ecosystem ser-
vices values, secondary axis). The network grows from local clusters to a near-globally connected sys-
tem through growth in link connections and periodic perturbations which give the clusters structure.
However, when natural capital has reached its lowest level, perturbations result in cascading failure in
the network (Heckbert 2013).
how the effects of climatic variability play out differently, depending on interacting factors such
as soil degradation, population density, deforestation, and trade networks, which all contribute
to the resilience or otherwise of the socio-ecological system.
The simulation provides understanding of the complexity and resilience of the socioeco-
logical system and insights into the sustainability of different trade, agriculture and water
management strategies under changing environmental conditions (Costanza et al. 2007,
Heckbert 2013). It allows the effects of different drought scenarios, trade networks, and shocks
like volcanic eruptions and hurricanes to be investigated. This is a major advance to our
understanding of linked human-environment relations, and is a step towards understanding
the environmental and societal interactions that underpin attempts to build sustainability
and resilience in a changing world (Costanza et al. 2007, Van der Leeuw et al. 2011).


Search WWH ::

Custom Search