Geoscience Reference
In-Depth Information
(a)
reservoir filling
suggests climate
variation also
contributed to onset
of lower lake levels
1m decline during infilling is
matched or exceeded several
times in the historical record
211.0
210.5
210.0
209.5
209.0
208.5
208.0
207.5
207.0
10 year running
mean
Average of 1968 to 1971
Filling of Williston
Reservoir (1968-1971)
1800 1810 1820 1830 1840 1850 1860 1870
1880 1890 1900 1910 1920 1930 1940 1950 1960 1970
Year
Established:
Ft. Chipewyan/Alberta
1788/1905
(b)
2
0
-2
-4
-6
-8
LIA
Highstand
Medieval
Lowstand
Mid-Holocene
Lowstand
5000
4500
4000
3500
3000
2500
2000
1500
1000
500
0
Age (cal year BP)
-3000
-2500-2000
-1500
-1000 500
0
500
1000
1500
2000
Year (BCE /CE)
Medieval
(“flashy” spring freshet;
low summer discharge; very low summer
discharge during eleventh century)
LIA
(delayed spring freshet;
sustained high summer discharge)
(c)
Twentieth Century
(low spring and
summer discharge)
Future?
(“flashy” but low
spring freshet; very low
summer discharge)
spring
summer
Time
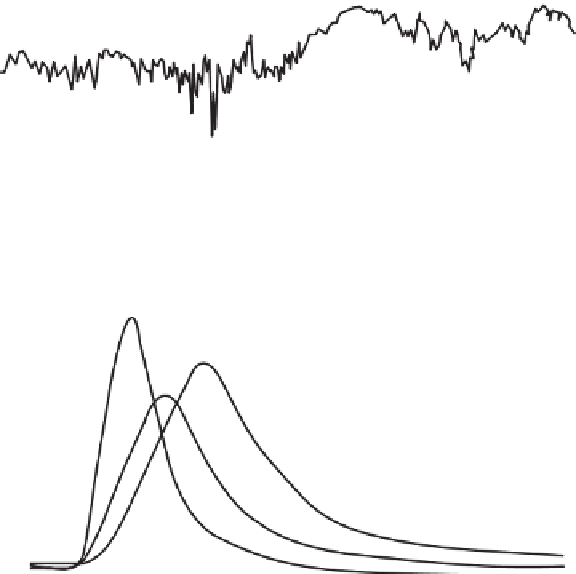
Figure 6.3
(a) Water-level reconstruction for Lake Athabasca 1810-1970 based on tree ring records. (b)
Lake Athabasca water-level record for the past 5,200 years relative to the twentieth century average,
inferred from C/N. The towns of Fort Chipew yan and the province of Alberta were established in times
of unusually abundant freshwater supply. (c) Evolution of hydrographs for rivers draining the eastern
slopes of the Rocky Mountains over the past millennium and anticipated future, based on assemblage of


Search WWH ::

Custom Search