Geoscience Reference
In-Depth Information
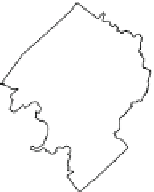
Fig. 4.4
Philadelphia
analysis sections (PAS)
12
8
11
9
10
7
6
4
5
3
1
2
20km
The highest mean modularity score .0:646/ is achieved with l
D
2 and l
D
3.
Notable local maxima can be observed for l
D
10 (0:598)andl
D
13 (0:600). For
l>19, the modularity score is basically at its minimum value.
In contrast to the previous experiment, no prior knowledge about clusters in the
data set is available; any parameter l might be as reasonable as any other one.
However, based on the objective of this experiment, three demands on l should be
met: First, parameter l should be chosen so that the modularity score is high, because
a high modularity score is a strong indicator of a clear-cut clustering structure.
Second, parameter l should be high enough so that a fair portion of the tracts' social
and demographic characteristics is taken into account in the process of clustering.
Third, parameter l should be low enough so that the resulting clusters tend to be
spatially contiguous. Spatial contiguity is in particular a useful property for spatial
planning and policy making, because spatially contiguous clusters can typically be
described by a single spatial outline, which eases perception and understanding of
the clusters.
Figure
4.3
exemplarily shows the graph resulting from a CNG that has been
trained with l
D
2, l
D
10,andl
D
13 alongside the regions that result from
clusters of the graphs. While the clusters for l
D
2 are the most spatially contiguous,
there is little difference between l
D
10 and l
D
13 observable. Additionally, the
graph for l
D
2 seems much more clearly structured than the graphs for l
D
10 and
l
D
13.
Furthermore, comparing Fig.
4.7
with Fig.
4.4
, it can be seen that the PAS,
which were designed for planning purposes, do not correspond well to the obtained
clusters. The PAS consist of 12 different regions, whereas the proposed method
determined only 5-6 clusters.


Search WWH ::

Custom Search