Geoscience Reference
In-Depth Information
5
10
15
20
25
l
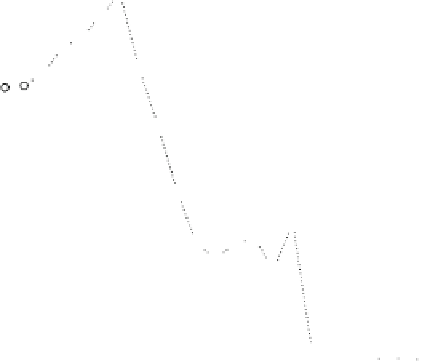
Fig. 4.2
Mean modularity score of 100 runs for different settings of l for the synthetic data set
0.0
0.2
0.4
0.6
0.8
1.0
x
Fig. 4.3
Clustering results for l D 7. The data points (
right
) are colored according to the colors
of the detected clusters of the graph (
left
). The thickness of the graph's edges corresponds to the
weights of the connections


Search WWH ::

Custom Search