Geoscience Reference
In-Depth Information
100
0.06
80
0.05
60
0.04
40
0.03
20
0.02
0
0.01
−20
0
−4
−2
0
2
4
20
40
60
80
Normal N(0,1)
OpenSpaceMeshSize
2
1.2
1
1.5
0.8
1
0.6
0.4
0.5
0.2
0
−4
−2
0
2
4
0.5
1
1.5
Normal N(0,1)
log
10
(OpenSpaceMeshSize)
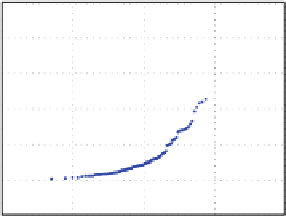
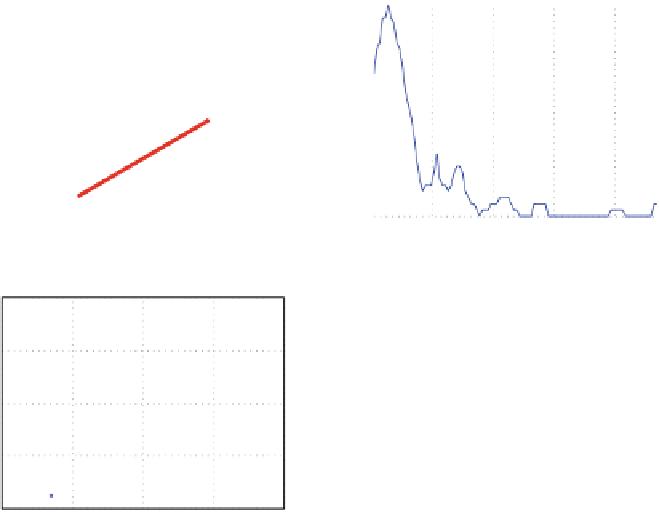
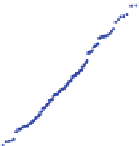
Fig. 3.5
Inspection of the variable OpenSpaceMeshSize using QQ-plot and PDE
OpenSpaceMeshSize is assumed to be lognormally distributed. Nonlinear trans-
formations of the variables, such as the logarithm for OpenSpaceMeshSize, are
used to determine the specific type of distribution. No complex transformations are
applied in order to understand the type of distributions.
The transformations used are from the so-called ladder of powers (Tukey
1977
),
which uses “understandable” transformations such as “log” and “sqrt”. These allow
for hypotheses on why the distribution is shaped in a particular way. As shown
above, OpenSpaceMeshSize can be assumed to be lognormally distributed. Such
distributions result from a product of many independent random variables; further-
more, exponential growth can be modeled using lognormal distributions (Limpert
et al.
2001
). Squared normal distributions, that is, when the square root of the
variable is normally distributed, indicate that the variable grows with a quadratic
area-related function.
In the UD data, for example, the variable ProtectedAreas seems to have this type
of distribution (cf. Fig.
3.6
).
In summary, the initial inspection of the individual variables aims to discover
the type and details of each variable distribution. If a variable is assumed to
follow a particular type of distribution (lognormal, mixture of Gaussians, etc.), a
first validation should be attempted by applying statistical tests for distributions


Search WWH ::

Custom Search