Geoscience Reference
In-Depth Information
a
b
2.5
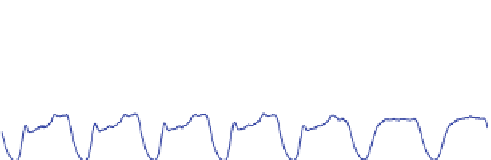
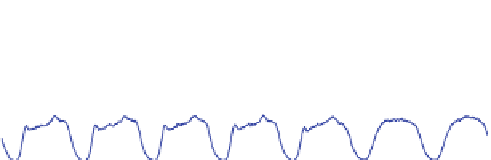
SMS
2
1.5
1
0.5
0
3
Calls
2.5
2
1.5
0.
1
0
2.5
Request
2
1.5
1
0.5
0
2
UL data
1.5
1
0.5
0
2
DL data
1.5
1
0.5
0
Mon
Tue
Wen
Thu
Fri
Sat
Sun
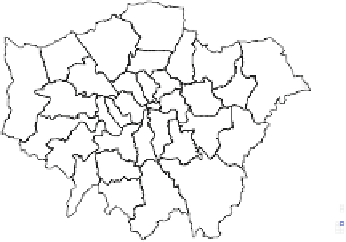
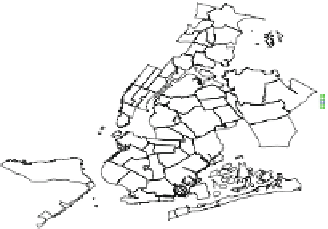
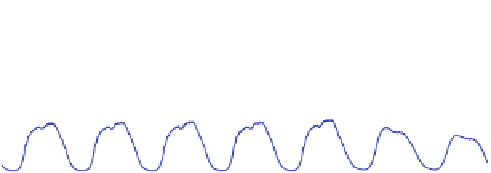
Fig. 15.9 Clustering the three cities at once
.(
a
) Spatial projection of K D 6 clusters of
all cities' counter data (
gray areas
correspond to zones with no recorded data). (
b
) Clusters'
signatures. Colors on the plots match those on the map


Search WWH ::

Custom Search