Geoscience Reference
In-Depth Information
a
Camden Market
City
Newham
Piccadilly Circus
Ealing Broadway
b
c
3.5
2
SMS
SMS
2.
3
1.5
1
1.
2
0.5
0
0.
1
−0.5
0
−1
3.5
1
Calls
Calls
3
0.5
2.5
1.
2
0
1
−0.5
0.5
0
−1
3.5
1.5
Request
Request
2.
3
1
0.5
1.
2
0
0.
1
−0.5
0
−1
3
1.5
UL data
UL data
2.5
1
2
0.5
1.5
0
1
−0.5
0.5
0
−1
3
1.5
DL data
DL data
2.5
1
2
0.5
1.5
0
1
−0.5
0.5
0
−1
Mon
Tue
Wen
Thu
Fri
Sat
Sun
Mon
Tue
Wen
Thu
Fri
Sat
Sun
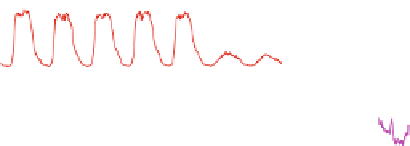
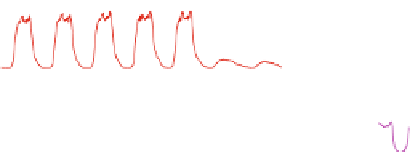
Fig. 15.5 Local signatures
(
a
) We selected five 500m by 500m grid pixels in specific locations
of Greater London. (
b
) The first series of plots shows these locations' signatures in the different
components of activity. (
c
) The second series of plots shows the differences between local and
whole city signatures. Colors in the plots match those on the map indicating the locations of the
selected pixels
The signatures of the pixel within the City of London show patterns typical of a
business area: high amount of activity during working hours and very low activity
in the evening from Monday to Friday and huge weekday-to-weekend activity
ratios. These signatures also display sharp transitions from low to high activity
level at the beginning of working hours and from high to low level at the end of
working hours.
The Piccadilly Circus signatures also show a large amount of activity during
working days, but also show significant activity during the weekend. The
morning transitions from no activity to some activity are rather smooth (notice in


Search WWH ::

Custom Search