Geoscience Reference
In-Depth Information
15.3
Spatial Repartition of Activity
A simple question that can be addressed with mobile communication data is the
tracking of where people are or where they go.
The first way to investigate this question is displayed on Fig.
15.2
a-c, which
shows the spatial repartition of total request activity as recorded in our datasets. We
chose to focus on the request activity since it passively tracks people: even if you
don't make any call or send any SMS, your mobile device will still produce network
background traffic such as social network synchronization, weather updates, news
feeds, etc.
The colors used on the maps of Fig.
15.2
a-c emphasize the inhomogeneities of
activity repartition, by showing the share of activity on each 500m by 500m pixel
normalized by the total activity recorded. A value of
D
1 hence corresponds to a
pixel with average total activity, >1to a pixel with higher than average activity,
and <1to a pixel with lower than average activity.
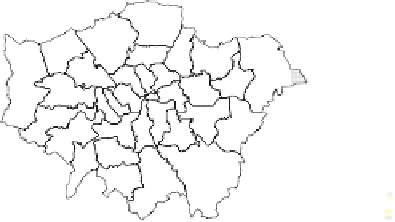
The spatial repartition of in the three cities shows a center/periphery dichotomy.
In Greater London, we observe a concentric organization, with a very strong activity
level in the City of London, and decreasing levels as one moves away from the
a
b
no data
ˁ
<0.5
0.5
<1
1
≤ˁ
<2
2
≤ˁ
≤ˁ
< 5
c
d
ˁ≥
5
1
Greater London
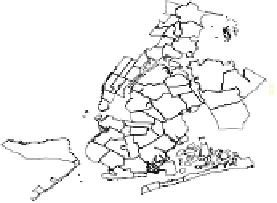
New York
Hong Kong
0.8
0.6
0.4
0.2
0
0
0.2
0.4
0.6
0.8
1
Cum. Area (in %)
Fig. 15.2 Spatial repartition of activity
.(
a
)-(
c
) show the values of normalized total request
activity aggregated over the 3 months of data on the pixel grids of resp. Greater London, New York,
and Hong Kong. (
d
) Lorentz curves showing the variation of cumulative total request activity with
the cumulative area of coverage, the pixels being ranked by increasing total request activity


Search WWH ::

Custom Search