Geoscience Reference
In-Depth Information
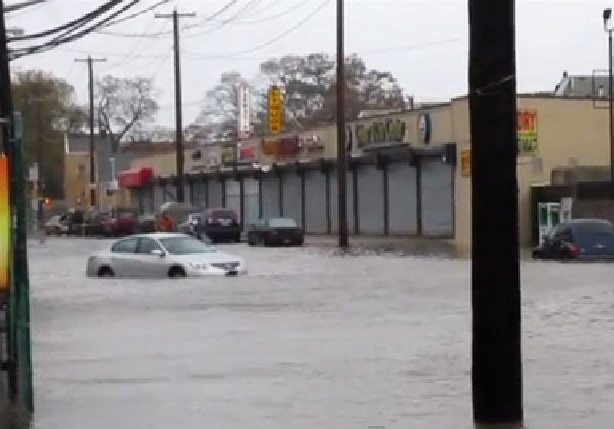
Fig. 14.9
Example of YouTube video documenting flooding
Overall, there is a very good agreement between the flood extent from FEMA
and the assessment generated with the proposed methodology. Figure
14.10
pro-
vides examples of agreement between photos identifying flooding/damage and
the FEMA-generated flood extent, while Fig.
14.11
includes examples where the
locations of flooding or damage did not agree between the Civil Air Patrol and the
FEMA data. These areas were located along coastal edges, and therefore a lack of
spatial precision in the data is most likely the cause of the discrepancies.
Sources of error in non-authoritative data, such as incorrect information (false
positive/negative) or improper geolocation, needed to be considered. Incorrect
information can be mitigated by including visually verified photos/videos and the
application of multiple sources. Crowdsourcing, in particular, can increase accuracy
and enhance information reliability compared to single-source observations (Giles
2005
). Geolocation errors can be reduced with automation.
Sparse data or data skewed in favor of densely populated or landmark areas
makes the use of non-authoritative data sources especially challenging. Increasing
data volume and integrating authoritative data into the methodology can yield
increased confidence and include underrepresented areas. Table
14.1
compares and
summarizes some features of each type of data. Although non-authoritative data
can provide timely, local information often in large volume, they are often viewed
with uncertainty. Conversely, the verification and authentication of authoritative data
yield trusted results at the cost of time.
Search WWH ::

Custom Search