Geoscience Reference
In-Depth Information
deviating westward and north-eastward, respectively. The yellow squares and teal
triangle clusters are examples of spatially embedded social groups that are
also
significantly clustered in a way that deviates from the expected spatial distribution
of agents the city.
Including these two examples, the spatial distribution of 58 social clusters, in
total, does form statistically significant “hot spots” (significantly dense clusters)
and “cold spots” (a mixture of modular groups) as shown with the Getis-Ord Gi*
statistic (Getis and Ord
1992
). Hot spots (light purple areas in Fig.
13.8
) contain
agents of the same modular group in two major regions. Cold spots (dark purple
areas in Fig.
13.8
) cover the downtown, signifying that the groups that frequent the
downtown are not clustered in the downtown, but have other group members around
the city.
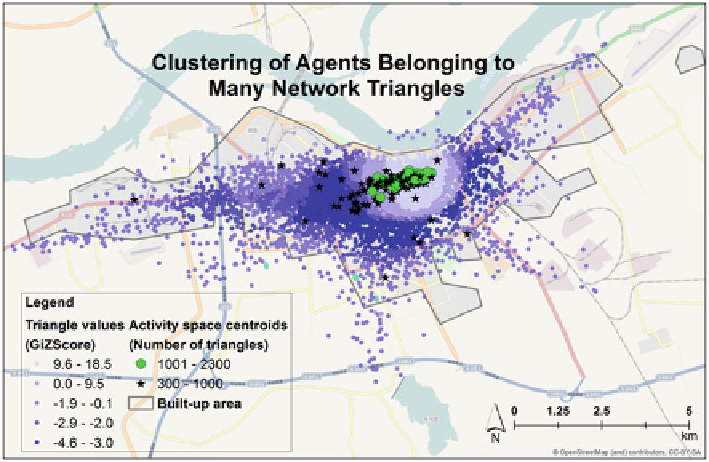
Another prominent pattern of community configuration, at a more local scale, is
the prevalence of social triangles in the network. A social triangle can be defined as
a group three nodes who connect to one another (Latapy
2008
) and, pragmatically,
will have meeting needs that are different and more complex than those of a dyad
but perhaps not as complex as a modular group, which can contain many nodes.
In our dataset, agents with the most social triangles cluster in the downtown area.
However, this may be an artifact of the high-degree users' downtown, as they are
likely to have more social triangles.
The distribution of high-triangle nodes (denoted in green circles and black stars
in Fig.
13.9
) follows a series of parallel roads downtown. Those with the highest
Fig. 13.9
A clustering of agents who are a part of many social triangles (i.e. groups of three
friends) congregate toward the urban core (
green circles
and
black stars
). This clustering is
statistically significant in one area east of downtown (denoted by
light to dark blue
), via statistical
Gi* Z scores
Search WWH ::

Custom Search