Geoscience Reference
In-Depth Information
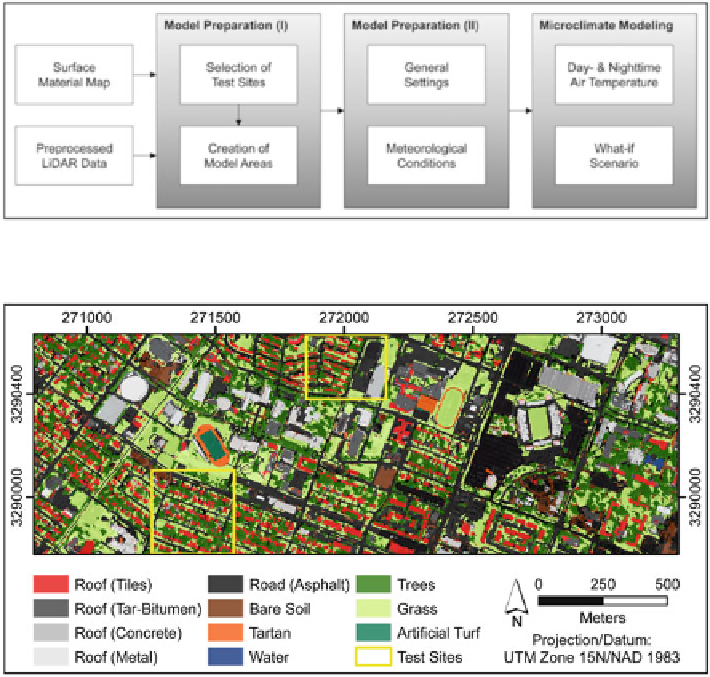
Fig. 11.3
The three-stage approach for microclimate modeling
Fig. 11.4
Surface material map of the study area in Houston
In the first stage, two modeling test sites were selected (Fig.
11.4
). The first test
site is located in the south of the study area .29°43
0
6:84
00
N;95
ı
21
0
47:57
00
W/ and
comprises three blocks of single-family homes, with each block being surrounded
by streets. This test site was used to model the spatial patterns of day- and nighttime
air temperatures. The second test site is situated in the north of the study area
.29°43
0
25:48
00
N;95°21
0
27:69
00
W/ and is mainly characterized by residential land
use (row development). However, the western part of the test site also features
a multilevel parking garage and two large parking lots that lie in-between the
residential area and the parking garage. This test site was used to set up a fictional
what-if scenario in which the two parking lots were replaced by multilevel parking
garages to assess the impact of such an urban planning measure on nocturnal air
temperatures in the adjacent residential area.
After their selection, a spatial model of both test sites was created in ENVI-
met. Each model area had a spatial resolution of 2.5 m. While the southern test site
consisted of 130
150
30 grid cells in x-, y-, and z-dimension, the northern test
Search WWH ::

Custom Search