Geoscience Reference
In-Depth Information
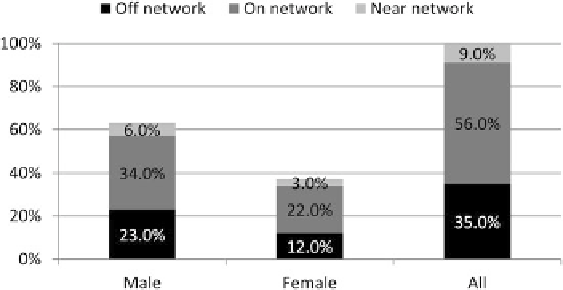
Fig. 8.8
Only home-to-work trips: gender and cycling with off/on/near network - corridor space
characteristics
the interpretation of static views in STC 3D environment challenging. For example,
on/off categories overlap almost near category points. Another perspective of STC
2D calendar view will be shown later to show another alternative to use the STC to
visualize spatiotemporal data.
One-way commute or only home-to-work trips have received attention since the
1980s (Hamilton and Röell
1982
; Boussauw et al.
2011
; Buehler and Pucher
2012
;
Dill and Carr
2003
; O'Kelly et al.
2012
; Shephard
2008
; Yang and French
2013
).
In our case,
only home-to-work trips
(i.e., commuting trips) trend follows similar
characteristics for
all trips shares
and
all other trips shares
.For
only home-to-work
cycle trips
, 56 % is found
on
the network (Figs.
8.8
,
8.9
and Table
8.4
). The peak
hour was found to be within the
ante meridian
and is around 9 am. Figure
8.9
provides another way of visualizing the spatiotemporal dimension of the dataset
referred to as calendar view in GeoTime. For clarity for the reader, the off/on/near
results were splitted into three and shown in each calendar view. By comparing the
presentation in Figs.
8.9
and
8.7
, it seems clearer using 2D calendar view than the
3D view in GeoTime. The 3D view appears to be more useful when visualizing one
category, for example, if all trips are considered by imagining that all the colors are
one and therefore just represent all trips without any categories.
Figures
8.10
and
8.11
show the corridor space characteristics for
all other trips
except only
home-to-work
cycle trips in the form of histogram and space-time
representation, respectively. Figure
8.11
shows the rush-hour time being moved to
the post meridiem where peak is around 5.30 pm. The present of all three categories
(i.e., off/on/near) exists, but only very general inferences can be made. Figure
8.11
shows that the 3D view can also be oriented in a way that if static view could
resemble the calendar view, this will help the interpreter to examine the timings
in detail. But still, visualizing more than one category may be difficult to present.
Tab le
8.5
shows the actual computed but weighted distance values for all other trips.
Search WWH ::

Custom Search