Geoscience Reference
In-Depth Information
used as a trade-off measure in the settlement of both on and off estimates. Second,
the ArcGIS
identity
function was applied to overlay the buffers with the primary
GPS data. Both the selected point sets forming cycle tips and the subsequently
generated cycle trips in the form of polylines were used. The
identity
function
computes the spatial intersection of features (points, lines, buffers) and merges their
respective attributes. Finally, the ArcGIS spatial statistic functions were used to
compute various distances, and database queries were used to extract trips of interest
for further space-time cube categorization and visualization. What follows are the
actual results from the corridor space analysis covering only home-to-work cycle
trips, all cycle trips except home-to-work trips, and all cycle trips. All percentages
were derived from weighted distances.
Figure
8.7
shows trip shares for the off/on/near regions for all cycle trips.
It also shows the temporal dimension of all the cycle trips per the on/off/near
regions. Figure
8.7
further suggests that longer trips occurred in November than
in October. Despite the possibility to infer some meanings from such a static 3D
visualization, practical experience with Kapler and Wright's (
2004
) implementation
of STC visualization suggests that an interactive form of visualization is more
useful. Although such an implementation of STC can be argued to partly satisfy
questions raised by Kraak (
2003
), there is the possibility, like in our case, that such
3D visualization for cycling data can only show a brief overview of activities but
may still be possible to sparkle the mind with ideas as suggested by Kraak (
2003
).
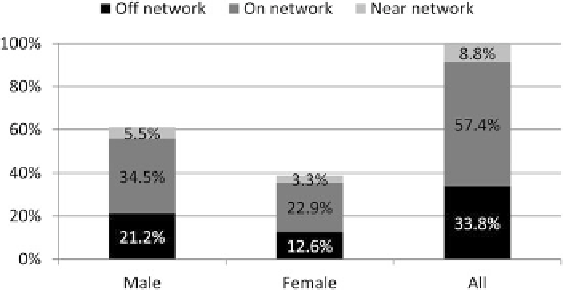
Findings from the corridor space analysis suggest that 57.4 % of cyclists' bike
trips were found on the cycle network, while 33.8 % cycles were found outside the
cycle network with 8.8 % near the cycle network (Fig.
8.6
). Also, for all cycle trips,
mentendtodominateincycling
on
and
near
the cycle network. Both male and
female tend to use the cycle network more than
off
the network for utility trips.
Figure
8.6
shows a more summarized form of Table
8.3
using a histogram.
Tab le
8.3
shows the details of the weighted distances for each of corridor regions
Fig. 8.6
All trips - gender and cycling with off/on/near network - corridor space characteristics
Search WWH ::

Custom Search