Geoscience Reference
In-Depth Information
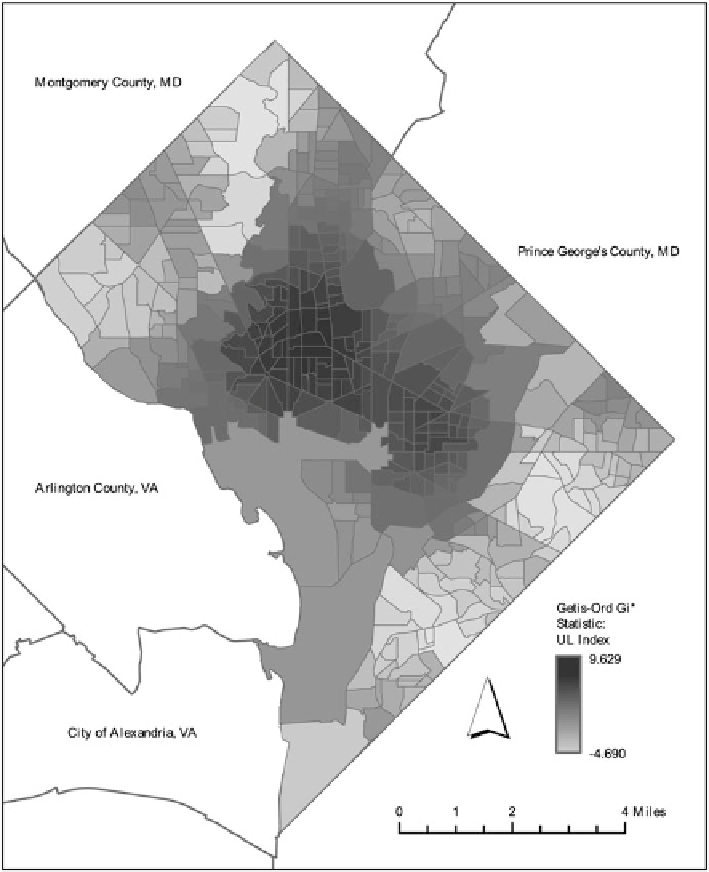
Fig. 7.13
Map of the Getis-Ord Gi* statistic for the composite UL index
as well as a strong clustering of low values. Here, high values indicate a higher
composite “livability,” while low values indicate a lower “livability” index.
Each of the maps presented in Figs.
7.12
and
7.13
confirm the analysis of high
and low-value areas noted earlier in the results, but they also serve to highlight the
degree to which the parameters do tend to cluster both at the high and low ends of
the spectrum.
Search WWH ::

Custom Search