Geoscience Reference
In-Depth Information
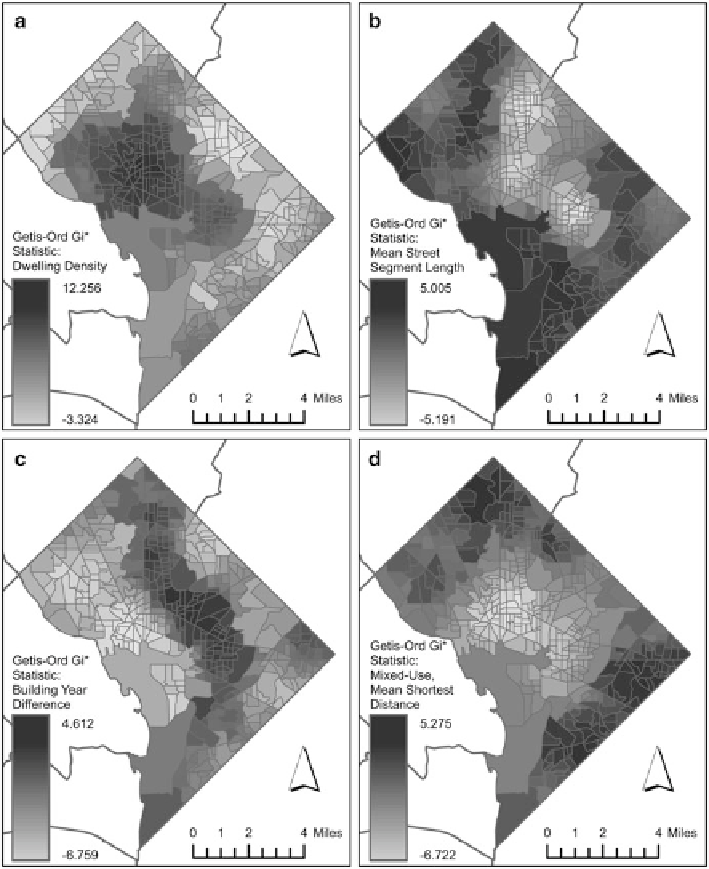
Fig. 7.12
Results of Getis-Ord Gi* statistic for local clustering of each livability measure.
(
a
) Getis-Ord Gi* results for dwelling density. (
b
) Getis-Ord Gi* results for mean street segment
length. (
c
) Getis-Ord Gi* results for building year difference. (
d
) Getis-Ord Gi* results for
mixed-use, mean shortest distance
This map shows a very strong clustering of low values and a weak clustering of high
values. Here, low values indicate a more mixed-use environment, while high values
indicate a less mixed-use environment.
Finally, Fig.
7.13
shows an unclassed choropleth map of the Getis-Ord Gi*
calculation for the
UL
index. This map shows a very strong clustering of high values
Search WWH ::

Custom Search