Geoscience Reference
In-Depth Information
evenly distributed throughout the city. This was verified by calculating the mean
distance to the nearest neighbor for the points with, and the points without, valid
year information.
Points with valid year information had a mean nearest neighbor ratio (observed
over expected) of 0.48, while points without valid year information had a ratio of
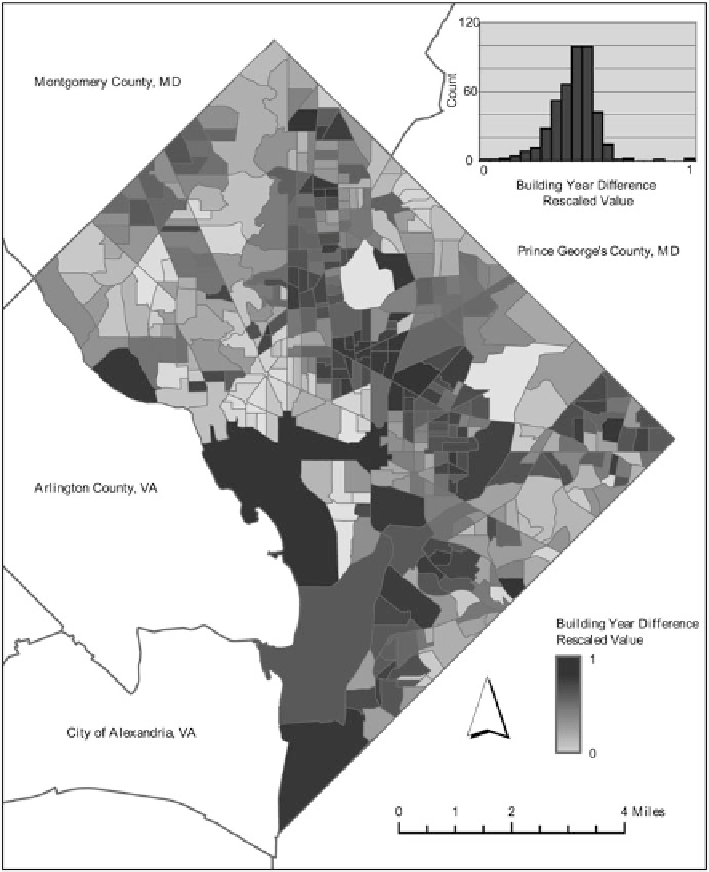
0.46. Using the valid points, the standard deviation for each block group ranged
from 0 to 53. These standard deviations had a mean of 21.78 and a standard
deviation of 5.67. Figure
7.5
shows the distribution of the standard deviations
Search WWH ::

Custom Search