Geoscience Reference
In-Depth Information
a
b
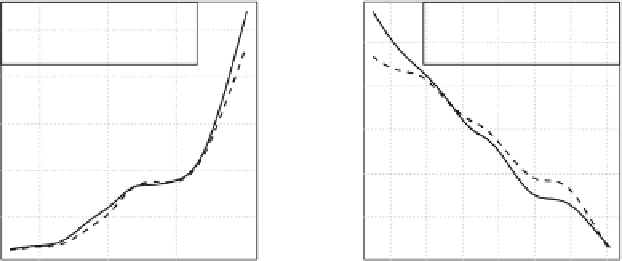
Effect of the share of academics
Effect of the age index
Mean regression
GAMLSS
Mean regression
GAMLSS
2400
1900
2200
1800
2000
1700
1800
1600
1600
1500
5
10
20
40
34
36
38
40
42
44
46
share of academics (%)
age index
c
d
Effect of the population density
Effect of the WKO house price index
2400
Mean regression
GAMLSS
Mean regression
GAMLSS
2100
2200
2000
1900
2000
1800
1800
1700
1600
1600
1500
0.1
1
3
10
30
100
50
100
150
200
population density
WKO house price index
Fig. 5.2
Effects of the neighborhood covariates.
First row
: effect of the share of academics (educ)
(
a
) and the age index (age_ind) (
b
).
Second row
: effect of the log of population density (ln_dens)
(
c
) and the house price index (wko_ind) (
d
). Shown are the posterior mean estimates of the mean
regression and the GAMLSS regression based on the gamma distribution
5.7.2
Quantiles
Figure
5.3
shows the effects for the structural covariates for the 20-, 50-, and 80 %-
quantiles. Beside the results of the mean regression and the GAMLSS regression,
we now also compare the effects of the quantile regression. Again, we hold all other
covariates constant at mean level of attributes and - if necessary - transform the
functions to natural units.
In general, the effects for the different quantiles are similar to those for the
expected house prices per sq. m., displayed in Fig.
5.1
. However, we can find some
interesting differences between the three models: Quantile regression estimates


Search WWH ::

Custom Search