Geography Reference
In-Depth Information
The following Example
1.8
and the following Box
1.21
illustrate this second additive measure
of deformation. In order to be simple, however, we have chosen the coordinate lines that are
illustrated in Fig.
1.20
.
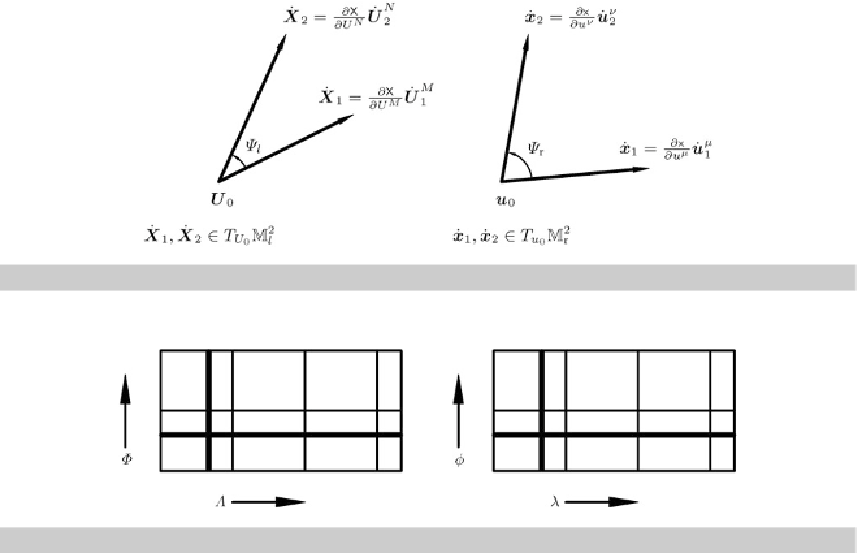
Fig. 1.19.
Angular measure of deformation, left and right shear
E
2
A
1
,A
1
,A
2
→
S
r
, left and right parameterized curves of type
Fig. 1.20.
Angular shear, isoparametric mapping
{
ellipsoidal parallel circle, ellipsoidal meridian
}
and
{
spherical parallel circle, spherical meridian
}
2
r
).
Example 1.8 (Angular shear or angular distortion,
f
:
E
A
1
,A
1
,A
2
→
S
Let us take reference to Example
1.3
, where we analyze the isoparametric mapping
f
=idfroman
ellipsoid-of-revolution
r
. Here, we shall continue the analysis
by computing angular shear or angular distortion of two parameterized curves in
l
=
A
1
,A
1
,A
2
r
=
M
E
to a sphere
M
S
M
l
=
E
A
1
,A
1
,A
2
as well as their images in
M
r
=
S
r
.
Left surface, parameterized curves: Right surface, parameterized curves:
(i) parallel circles:
(i) parallel circles:
(1.135)
U
1
=
Λ
=
t
l
,U
2
=
Φ
= constant;
u
1
=
λ
=
t
r
,u
2
=
φ
= constant;
(i) meridians: (ii) meridians
U
1
=
Λ
= constant
,U
2
=
Φ
=
t
l
.u
1
=
λ
= constant
,u
2
=
φ
=
t
r
.
(1.136)
U
1
(
t
l
)=
Λ
(
t
l
)
=
t
l
,
t
r
constant
=
λ
(
t
r
)
=
u
1
(
t
r
)
,
Φ
(
t
l
)
constant
φ
(
t
r
)

Search WWH ::

Custom Search