Geography Reference
In-Depth Information
(8 +
η
0
(34
21
t
0
)+
η
0
(44
39
t
0
)+18
η
0
(1
t
0
)) cos
2
B
0
−
−
−
b
2
l
2
+
−
180
V
0
360
V
0
2+4
η
0
(7
b
4
1080
t
0
)+
+
η
0
(24
−
2109
t
0
+ 7560
t
0
)
−
3240
η
0
t
0
(1 + 4
t
0
)
.
6
t
0
)+
η
0
(50 + 1107
t
0
−
+
−
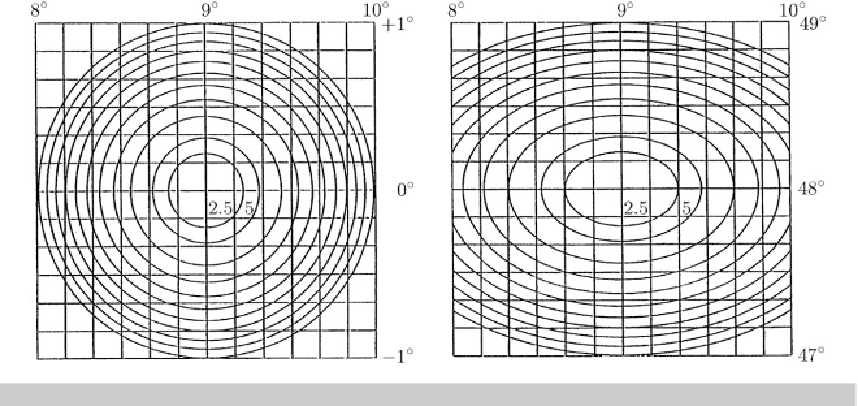
Figures
20.8
,
20.9
,and
20.10
illustrate over a 2
◦
×
2
◦
grid the principal distortion
Λ
1
(
x, y
)as
well as the maximum angular distortion
ω
for
L
0
=9
◦
and (i)
B
0
=0
◦
, (ii)
B
0
=48
◦
, and (iii)
B
0
=70
◦
. respectively. Figure
20.11
illustrates the local Riemann mapping and the distortion
ellipses with axes
{Λ
1
,Λ
2
=1
}
.
Fig. 20.8.
Principal distortion
Λ
1
[ppm], Riemann coordinates.
Left
:
L
0
=9
◦
,B
0
=0
◦
.(equator).
Right
:
L
0
=9
◦
,B
0
=48
◦
For a local representation of the ellipsoidal surface, namely the reference figure of the Earth,
conformal Gauss-Krueger and parallel Soldner coordinates are the most popular. Therefore, they
are compared with (Riemann) polar/normal coordinates. As a
measure
of the
total deformation
energy
(total distortion energy), according to
Airy
(
1861
), we introduce (
20.142
)oncewemap
the area over the
symmetric strip
(
20.141
).


Search WWH ::

Custom Search