Information Technology Reference
In-Depth Information
∑
(
a
)=
{
F
(
a
,
t
)
|
t
∈
T
}.
(3.5)
The arrowhead of the vector
F
(
,
)
moves in the space
S
(a) on a trajectory that
describes the history or the lifeline of the system
a
.If
a
is an organism, this lifeline
starts at the birth and it ends at the death of the system.
The set of all possible states of
a
is restricted by some laws the components
F
i
have to observe, e.g. the heart frequency of a human is not between zero and infinity
but between 30 and 200 beats per minute. Therefore, the allowed states of
a
build
the subset
S
L
(
a
t
a
)
of
∑
(
a
)
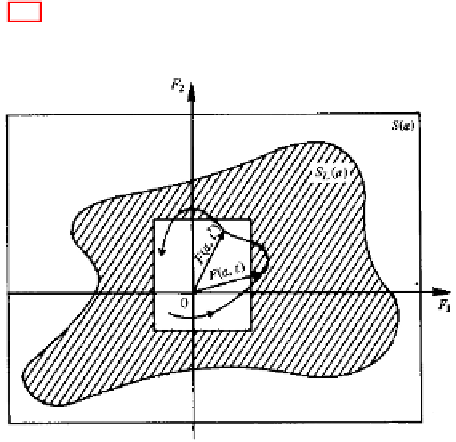
(Fig. 3.3 (b)).
(a)
(b)
Fig. 3.3
(a): Mario Bunge in the 1970s.; (b) his schema of an organism with two properties
represented by functions
F
1
and
F
2
[15].
There are states of health and states of illness for every organism: if a biological
system is in a state of health than the organism works optimally, if this is not the
case, it is in a state of illness. Thus, in the case of a healthy organism the values
of
F
i
i. e. the corresponding function of the system's property
P
i
is restricted to a
subinterval of values of the interval of all possible
F
i
-values. Therefore, the states of
health of a system
a
build a parallelepiped in the set
S
L
(
of all allowed states. Fig.
3.3 shows Bunge's fictive case of a animated system that is characterized by only
two properties, represented by the functions
F
1
and
F
2
. The hatched zone is the set
of the ill (but living) states of the system a whereas the white rectangle in this zone
is the set of all health states. The curve is the lifeline of the organism and we see
that this organism is healthy for the most time of its life but some parts of the curve
lay in the zone of ill states.
a
)