Environmental Engineering Reference
In-Depth Information
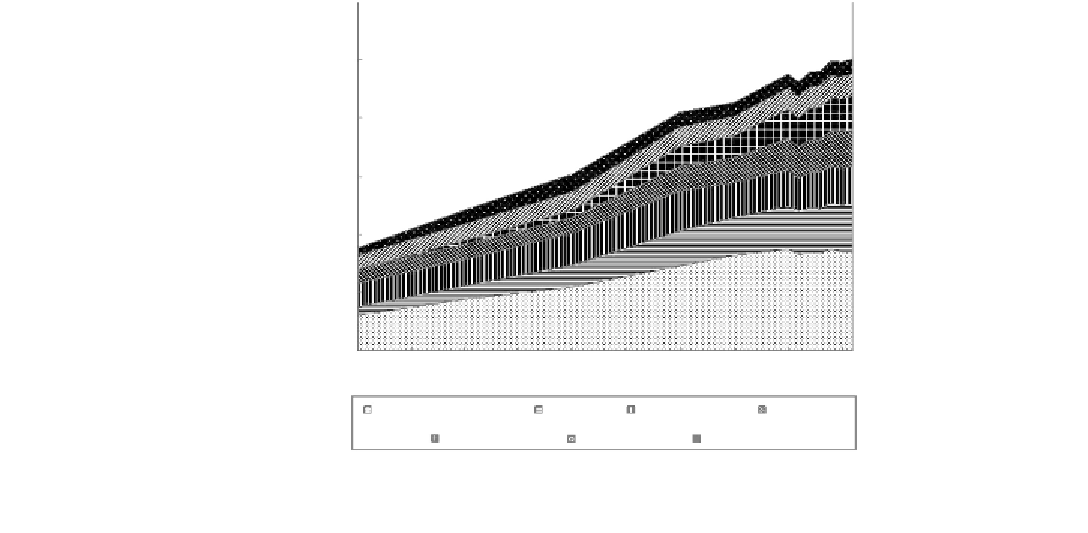
Generation of Materials in MSW, 1960 to 2006
"All other" includes primarily wood, rubber and leather, and textiles.
300,000
250,000
200,000
150,000
100,000
50,000
0
1960
1965
1970
1975
1980
1985
1990
1995
2000
2005
Year
Paper and paperboard
All other
Yard trimmings
Food scraps
Plastics
Metals
Glass
Figure 5.2
Municipal solid waste generated in the United States from 1960 to 2006 (U.S.
EPA 2007)
3
SOLID WASTE MANAGEMENT SYSTEM
Based on the U.S. EPA tiered integrated waste management strategy, a proposed
flow chart of a typical municipal solid waste management system is illustrated
in Figure 5.3. The source of all municipal solid waste starts with consumers.
During the past 45 years, the amount of waste each person generates has almost
doubled, from 2.7 to 4.54 pounds per day. If the consumer and business can
use less of a resource, it will be the best way to avoid the waste generation.
However, this reduction of using resources involves education, and depends on
business practices, various cultural, and social and economic factors that may
not be controlled by the planner or engineer.
Source reduction, often called
waste prevention
, is defined by the U.S. EPA
as “any change in the design, manufacturing, purchase, or use of materials or
products (including packaging) to reduce their amount or toxicity before they
become municipal solid waste. Prevention also refers to the reuse of products
or materials.” Source reduction can be an effective way to reduce the waste
generated for collection and disposal. This includes reusing any jars and bottles,
grocery bags, and waste papers. Consumer practices can also be changed to
reduce waste. For example, consumers can purchase long-life products, repair
used products instead of purchasing new ones, and reduce junk mail. Food and


Search WWH ::

Custom Search