Environmental Engineering Reference
In-Depth Information
Ta b l e 5 . 2
Composition of Municipal Solid Waste Generated in the United States from
2000 to 2006 (in 1000 tons and percentage
∗
)
Waste Component
Weight
Percentage
2006 Percentage
Paper and Paperboard
82,660-87,550
33.9-36.8
33.9
Glass
12,340-13,200
5.1-5.4
5.3
Metals
18,280-19,130
7.5-7.9
7.6
Plastic
25,270-29,490
10.6-11.7
11.7
Rubber and Leather
6,540-6,820
2.6-2.8
2.6
Textiles
9,810-11,840
4.0-4.7
4.7
Wood
13,020-13,930
5.5-5.7
5.5
Food Waste
26,980-31,250
11.4-12.4
12.4
Yard Waste
27,980-32,400
12.7-13.1
12.9
Other
∗∗
7,690-8,270
3.3-3.4
3.4
Total MSW Generated
∗
231,230-251,340 100
∗
Generation before materials recovery or combustion. Does not include construction and demolition
debris, industrial process wastes, or certain other wastes.
∗∗
Includes miscellaneous organic and inorganic wastes.
Source: U.S. EPA 2007
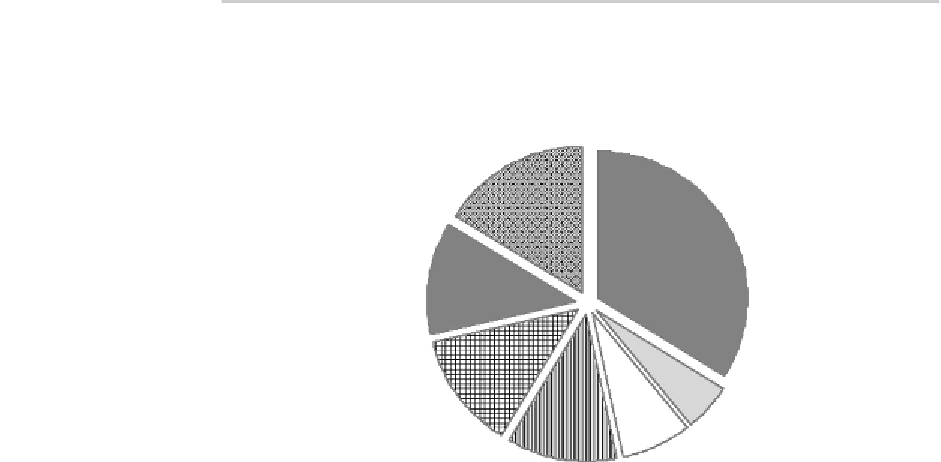
Other wastes
16.1%
Paper and
paperboard
33.9%
Food wastes
12.4%
Yard trimmings
12.9%
Glass
5.3%
Metals
7.6%
Plastics
11.7%
Figure 5.1
Composition of municipal solid waste generated in the United States in 2006
(percentages of total generation)
in 2006, although it also stabilized since 2004. Its low-density, high-strength,
user-friendly design and fabrication capabilities and low cost are the drivers to
such growth (Subramanian 2000). It is also interesting to note that the generation
of glass, metals, and yard waste has been more or less steady throughout the
years.


Search WWH ::

Custom Search