Biomedical Engineering Reference
In-Depth Information
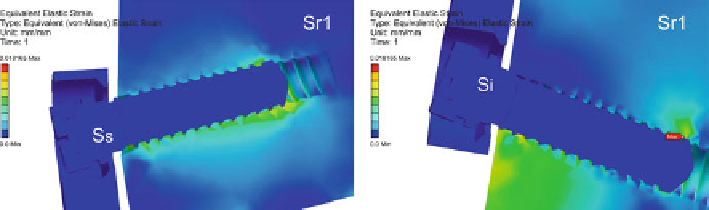
Fig. 7.20
Bone strains acting on Sr1 superior and inferior mountings
The first simulation was performed for
Sr1
bone screw mounting. In Fig.
7.20
,
the results are presented as color maps, where the color spectrum ranges from dark
blue to bright red, having the higher strain values in red color.
By comparing the strains acting on the bones at the Ss and Si interfaces, differ-
ent effects are identified. The differences in strains show us how the loads acting
on the C2 vertebra are transmitted to the bones, bone screws, and bone plate.
Since the superior bone screws (axially loaded) manifest tension in the bone inter-
face, the inferior bone screws manifest an indirect tension in the lower longitudi-
nal section of the tapped hole. The tension borne in the lower screw is caused by
the bending effect of the plate.
In a pure tension test, the strains should be uniformly distributed on the threads.
But, due to the flexion moment applied to the structure, and also due to the gravi-
tational forces, the strain distributions on holes are anything but uniform. In the
superior hole, the strains are higher next to the lower section of the screw tip,
while in the inferior hole, the strains are higher next to the upper section of the
screw tip.
This coupling effect is manifested in both bone screws and it generates a com-
pression effect on the bones. This strain variation is graphically presented in
Fig.
7.21
, as function of threads number. From the biomechanical point of view, this
phenomenon leads to local bone micro-cracks, and sometimes can cause failure.
The bone failure represents the first step in screw pullout effect, and the beginning
of the implant system failure.
The subject of the second simulation was the bone screw
Sr2
, and its effect on
the bone. In order to acquire comparable results between screws effects on the bone
structure, the loading and fixing conditions of the simulation were maintained. Also,
the position order of the screw and the contact arrangements are identical. The
results in Fig.
7.22
reveal an identical strain distribution as in the first case, which
proves the repeatability of the simulation. The differences appear in the strain val-
ues. The maximum value of strains in the superior section is around 0.004 mm/mm
meaning only a half of the value recorded in the first case.
As the variation graphics indicate (see Fig.
7.23
), the lower strain induced by
the bone screw
Sr2
into the bone interface can be directly influenced by the thread's
profile. This proves that a deeper thread, which engages more bone between the
Search WWH ::

Custom Search