Biomedical Engineering Reference
In-Depth Information
0.18
0.16
0.14
0.12
0.10
0.08
0.06
0.04
2988
2943
2910
3128
ECN Monomer
2988
0.02
2944
0.00
2908
-0.02
ECN Poloymer
-0.04
3400
3200
3000
2800
Wavenumber(cm
-1
)
0.85
1737
0.80
1291
0.75
1192
0.70
0.65
1388
0.60
1320
0.55
1240
1738
1021
0.50
1408
0.45
989
804
868
839
1113
1371
0.40
1097
1615
ECN Monomer
1447
1011
0.35
714
2239
937
0.30
1156
0.25
856
0.20
1443
1371
1110
0.15
ECN Poloymer
1471
0.10
805
745
0.05
0.00
-0.05
2000
1500
1000
Wavenumber(cm
-1
)
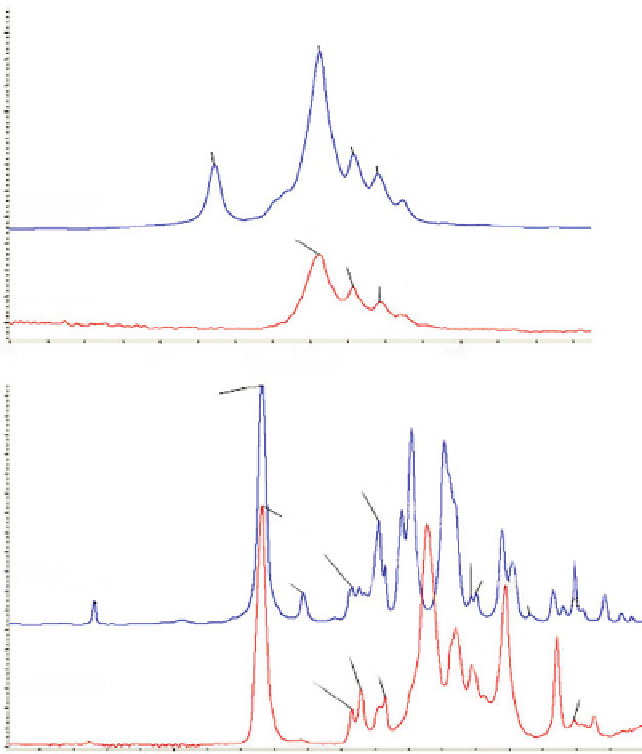
Fig. 5.10
Selected regions in the ATR-IR spectra of the ethyl cyanoacrylate monomer and polymer
cyanoacrylate is produced throughout these C=C bonds [
1
] . Furthermore, after
polymerization of the ECN the intensity of the CH
3
group decreases.
The thermal properties of the cyanoacrylate polymers also differ from those of
the corresponding monomers. Figure
5.11a
shows as typical example the TGA ther-
mograms of the BCN monomer and polymer. After polymerization the degradation
temperature of the cyanoacrylate increases noticeably and the percentages of the
two different structures found in the TGA of the monomer (Fig.
5.8a
) change and
almost similar content is obtained. The different polymer structures can be better
distinguished in the derivative curves of the TGA thermograms given in Fig.
5.11b
.
Table
5.6
summarizes the weight loss and temperature of the different thermal
decompositions of the ethyl,
n
-butyl, and
n
-octyl cyanoacrylate polymers. In general,
Search WWH ::

Custom Search