Biomedical Engineering Reference
In-Depth Information
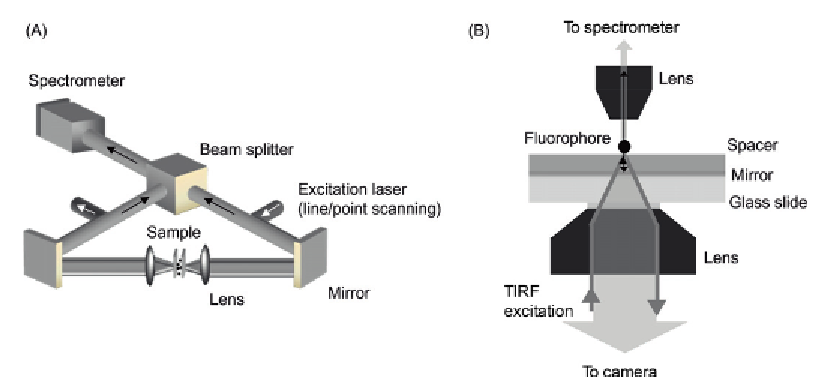
Figure 18.3
Experimental realizations of SD-FPM. (A) Line-focus or point-scanning illumination and a
spectrometer are employed to spectrally resolve fluorescence self-interferences from the sample.
The axial (depth) profile of the fluorophore distribution at each transversal point is obtained by
performing the inverse discrete Fourier transform. (B) A TIRF-based SD-FPM employing a
common-path-folded interferometer. The lateral localization is obtained by analyzing the
diffraction-limited image of individual emitters, whereas the axial localization is retrieved through
Fourier analysis. Source: (A) This figure is reproduced from figure 1 of Ref.
[41]
with permission of the
Optical Society of America.
differential optical path-length point z
0
of the self-referencing interferometer). As seen in
Eq. (18.2)
, the location of a fluorophore along a particular axial line is encoded by the
interferometric frequency modulation of the emission spectrum, where the frequency is
proportional to the fluorophore's distance from z
0
. The axial (depth) position of the
source (z) can be retrieved with mesoscopic accuracy by analyzing the periodicity of the
self-interference-induced modulation of the source PSD (S(k)cos(2kz)) in the spectral or
spatial domains. The spatial analysis can be executed by identifying the z position that
corresponds to the peak value in the modulus of the Fourier transform of
Eq. (18.2)
.
Similarly to TD-FPM, the z position of the source (z) can be extracted with nanometer
precision. This ability is achieved either by examining the differential phase shifts of the
modulated spectrum S(k)cos(2kz)or by analyzing the minute axial shifts of the source
autocorrelation function
(
) following the Fourier transform of
Eq. (18.2)
. As in TD-FPM,
the axial localization precision is determined by the detected SNR and approximately
increases inversely with its square root.
γ
The main components of the SD-FPM system are (i) excitation optics, (ii) a self-referencing
interferometer, and (iii) a 1D/2D spectrometer. Typically, the excitation optics comprises a
scanning point/line-focus or a wide-field illumination depending on the application. While a
Search WWH ::

Custom Search