Biomedical Engineering Reference
In-Depth Information
aster image in
Figure 15.4C
as an example. The radial array of MTs shows two bright
and dark quadrants. In the bright quadrants, the MTs' slow axis runs more parallel to
the compensator slow axis, while in the dark quadrants, the slow axis of the MT
birefringence is oriented nearly perpendicular to the slow axis of the compensator.
As the compensator is rotated from its extinction position, the specimen turns darkest at a
characteristic angle
θ
min
. Given the known compensator retardance
R
cmp
, the angle
θ
min
is a
direct measure of the specimen retardance
R
spc
:
R
spc
5
R
cmp
sin
ð
2
θ
min
Þ
Figure 15.5A
shows a graph of the intensity calculated for a uniformly birefringent
specimen area (or single specimen point) as a function of the rotation angle
θ
of a
Brace-K¨hler compensator. At the rotation angle
min
, the intensity is a minimum. For other
rotation angles, the intensity varies according to a complex expression of trigonometric
functions that can be derived using the Jones calculus. This expression can also be used to
calculate the expected contrast of a birefringent object against its nonbirefringent
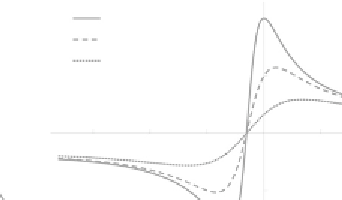
background. The graph in
Figure 15.5B
shows the computed contrast of the birefringent
θ
(A)
(B)
I
spc
-
I
bg
I
spc
+
I
bg
Intensity
0.15
Contrast =
I
bg
(
R
sec
=0)
1.0
I
min
= 0
I
spc
(
R
sec
=
λ/
50)
I
min
= 0.002
I
min
= 0.01
0.1
0.05
-30°
-20°
-10°
20°
Compensator angle
θ
10°
30°
I
min
=0.005
-45°
0
45°
90°
-90°
θ
min
-1.0
Compensator angle
Figure 15.5
(A) The graph shows intensities detected in a single image point or uniform area of the specimen
versus the rotation angle of a Brace-K
¨
hler compensator. Dashed curve shows the background
intensity I
bg
of a specimen area that exhibits no birefringence. The solid curve shows the intensity
I
spc
of a specimen point that exhibits a small retardance (
/50). The transmitted intensity is given
as a fraction of the amount of light that has passed through the first polarizer. I
min
represents the
spurious intensity that is detected when the compensator is in the extinction position. (B) This
graph shows the contrast of a birefringent specimen point (R
spc
5
λ
λ
/50) as a function of
compensator angle, for three different values of I
min
. I
min
is affected by the quality of the
polarizers used and the polarization distortions introduced by the intervening optics (condenser
and objective lens). Both graphs were generated computationally using the Jones calculus and
assuming a retardance of
/10 for the birefringent crystal plate of the Brace-K¨hler compensator
and a specimen retardance of
λ
/50 with slow axis oriented at 45
λ
to polarizer and analyzer.


Search WWH ::

Custom Search