Biomedical Engineering Reference
In-Depth Information
(A)
(B)
4
0
4
0
5
5
0
0
10
10
2
2
4
4
6
6
8
8
10
10
12
12
15
15
14
14
16
16
0
1
2
3
z
(
μ
m)
(D)
x 10
-3
(C)
2
4
0
1
0
5
-1
0
10
2
Ideal
4
6
8
10
Measured ±SD
12
15
14
-2
16
500
550
600
650
4
5
6
7
-In (
σ
Δ
n
) (-)
3
Wavelength (nm)
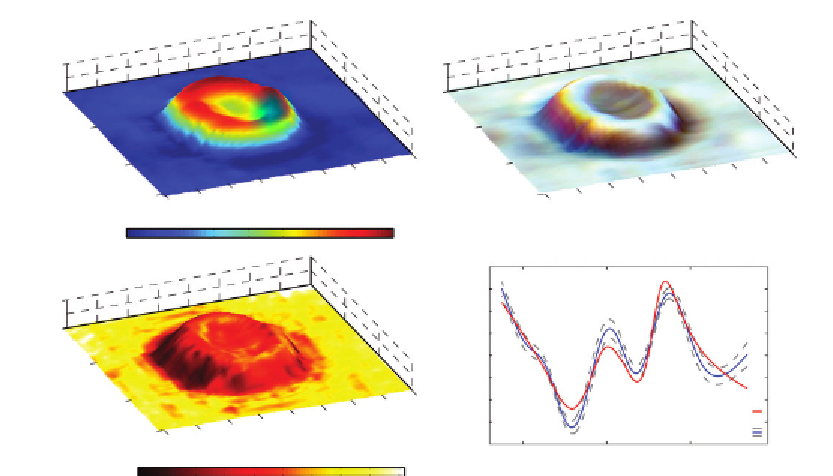
Figure 14.12
(A) Topological map of a healthy RBC. (B) True color representation superposed with the
topological map. (C) Negative log of the standard deviation of the changes in the real part of the
RI superposed with the topological map. (D) Representative spectral profile of the real part of
the RI. Source: From Ref.
[60]
.
31.6
8.2 g/dl, respectively. These numbers are also in good agreement
with the expected values.
6
13.0, and 36.7
6
As described above, NLDS is a novel technique which measures the dispersion profile of a
sample across a wide spectral bandwidth and with high spectral resolution. Furthermore, the
technique may be integrated with SDPM and SOCT to obtain topological maps of samples
along with their absorptive properties, all from a single measurement
[57]
. We have also
demonstrated NLDS's ability to detect and quantify different dispersion-inducing
molecules, specifically a synthetic fluorophore and oxy-Hb. These results have important
implications for the diagnosis of various RBC diseases, e.g., sickle-cell anemia, thalassemia,
and malaria, using only intrinsic spectroscopic information from the cells. Additionally,
NLDS may be also used for molecular imaging with exogenous agents to monitor cell
receptor expression and disease states. Moreover, a recent theoretical treatment
[68]
showed that the mean free scattering path length and isotropic coefficient can be derived
from the spatial variance and variance gradient of the phase, respectively. Looking forward,
NLDS may be integrated with such analysis to provide a more complete picture of the
Search WWH ::

Custom Search