Biomedical Engineering Reference
In-Depth Information
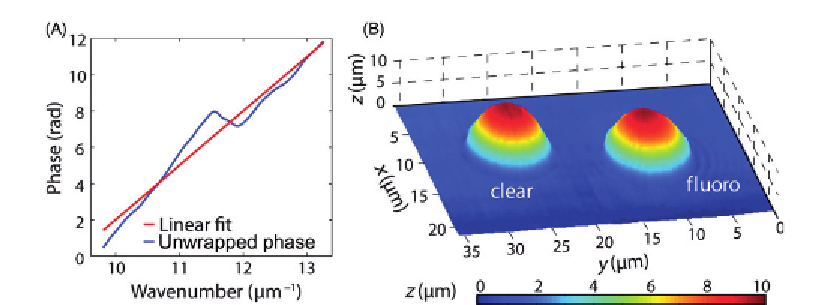
Figure 14.10
(A) Unwrapped phase of an interferogram acquired from the center of the fluorescent bead and
the line of best fit used to correct for dispersion effects. (B) Topological map of nonfluorescent
(clear) and fluorescent (fluoro) beads. Source: From Ref.
[60]
.
analysis using NLDS, as discussed later. The removal of this residual phase yields a
dispersion-compensated interferogram. Finally, an FFT of the compensated signal may be
computed, and the location of the peak and the angle (phase) at the same point are used to
determine the optical path length,
n
(
ω
0
)
d
, with nano- to picometer sensitivity. For this bead
sample, an average RI of
n
0
0.12 is used to convert the
phase information to a topological map of the sample. The resulting maps for both a
nonfluorescent and a fluorescent bead are shown in
Figure 14.10B
. The sensitivity of the
system is 5 nm as determined by the standard deviation of fluctuations within a background
region.
5
n
bead
2
n
glycerol
5
1.59
2
1.47
5
Now the absorption spectra are analyzed. Returning to
Eq. (14.8)
, now the dispersion-
compensated interferograms contain only the first two terms (intensity and linear phase).
Consequently, the absorption spectrum, which is the first term of
Eq. (14.8)
, can be
computed by taking the absolute value of the signal.
Figure 14.11A
shows two curves
corresponding to the negative log of the spectrally resolved intensity, i.e.,
)
d
, for both
the fluorescent and nonfluorescent beads. The figure also shows the ideal extinction
coefficient of the fluorescent bead, as provided by the manufacturer, which is in good
agreement with the experimental results, exhibiting an extinction maxima located at
540 nm. For each point in the sample, we repeat this procedure. The obtained absorption
spectra are then normalized and divided into red, green, and blue channels using the
Commission Internationale d'Eclairage (CIE) color functions, providing a true color
representation of the samples, as shown in
Figure 14.11B
, where the hue and saturation
information is superposed on the topological map. As expected, the background and clear
bead are relatively colorless, in contrast to a pink hue shown by the fluorescent bead. These
colors are consistent with the appearance as seen by the naked eye or under a microscope.
μ
tot
(
ω
Search WWH ::

Custom Search