Biomedical Engineering Reference
In-Depth Information
(A)
(B)
(nm)
30
15
0
-15
-30
30
(C)
20
Cr
Glass
10
0
-10
-20
5.0
μ
m
d
1
3.8
μ
m
0
10
0
5
15
20
25
30
Lateral position (
μ
m)
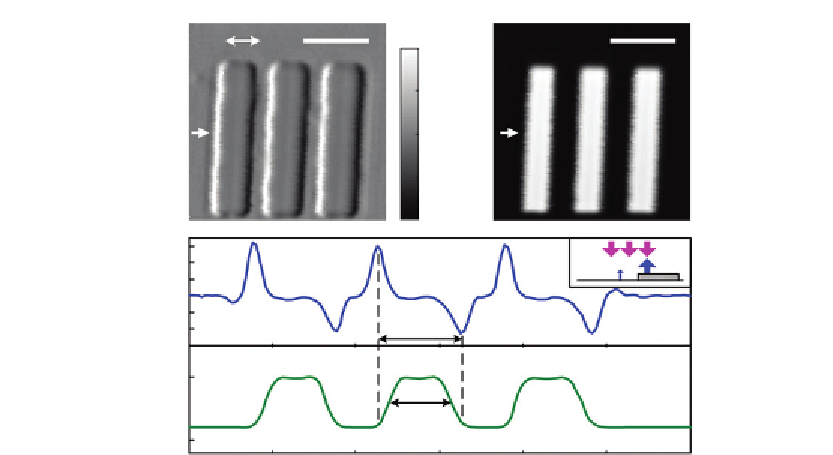
Figure 14.4
SD-DIC images of a USAF resolution target. (A and B) OPL gradient and brightfield intensity
images of Group 7, Element 1; double arrow indicates the shear direction; scale bar is 10
m.
(C and D) Cross-sectional profiles of (A and B) at positions indicated by the single arrows; inset
explains the increased bar width in (A). Source: From Ref.
[23]
.
μ
in the phase image of an object may not accurately reflect its true size. Despite this artifact,
the intensity image will still carry size information faithfully and may be used together with
the phase image to better characterize the object. In addition, this phenomenon is expected
to have minimal effect for most biological samples since they do not usually exhibit such
steep intensity changes.
14.3.3 Live Cell Imaging with Rat Cardiomyocytes
We also performed live cell imaging with the SD-DIC system, recording fast cellular
dynamics at selected sites. For sample preparation, ventricular cardiomyocytes were isolated
from 2-day-old Sprague Dawley rat neonates using sequential trypsin and collagenase
digests, depleted of fibroblasts by differential attachment, and then cultured for 24 h on a
reflective surface coated with human fibronectin before imaging in low-serum
differentiation medium at 22
C
[24]
.
Figure 14.5A and B
shows the OPL gradient and intensity images of an isolated
cardiomyocyte. The intensity image has an artifact, appearing as a bright spot on the left
Search WWH ::

Custom Search