Biomedical Engineering Reference
In-Depth Information
1 kHz modulation
15 kHz modulation
60 kHz modulation
10
8
6
4
2
0
10
8
6
4
2
0
10
8
6
4
2
0
(
A)
(
B)
(
C)
0
10
20
30
0
10
20
30
0
10
20
30
Time (ms)
Time (ms)
Time (ms)
1200
200
8
(
D)
(E)
SNR = 70
±
24
SNR = 112
±
45
(F)
SNR = 2
±
0.4
1000
800
600
400
200
0
0
150
6
100
4
50
2
0
0
2468 0
Frequency (kHz)
0 2 4 6 8 0
55
7 9 1 3 5
Frequency (kHz)
Frequency (kHz)
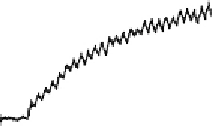
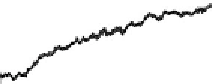
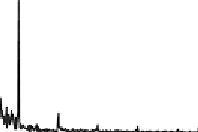
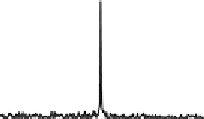
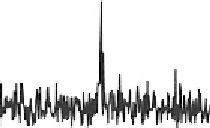
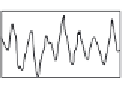
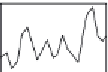
Figure 13.10
F) Fourier
transforms of the measured phases at various 808 nm laser modulation frequencies. The vertical
lines in (A
(A
C) Phase of the gold nanoparticles measured by photothermal OCM. (D
C) show the time points when the 808 nm laser was activated. Insets in (B and C)
show enlarged views of the measured phase. The 808 nm laser modulation frequencies were 1 kHz
(A and D), 15 kHz (B and E), and 60 kHz (C and F). Source: Taken with permission from Ref.
[23]
.
Copyright of J. R. Soc. Interface.
can be detected in a way that significantly reduces background noise. The SNR was
defined as the ratio of the signal peak to the noise value. The phantom used in the
photothermal experiments described achieves mean SNRs of 2
131. The high SNR
suggests that lower concentrations of nanoparticles could be detectable using this method
compared to other methods, allowing for in vivo applications where the marking agent is
administered systemically and accumulates at lower levels in diseased tissue.
Figure 13.10
shows the measured phases and their Fourier transforms. A similar photothermal
OCM method was used in Ref.
[24]
.
13.5 Conclusions
In recent years, use of phase-sensitive OCM in biomedical research has grown widely.
Technological improvements resulted in the utilization of this method variety of in this field
of research. Phase OCM has the combined advantages of in vivo imaging, noninvasive,
subnanometer OPD sensitivity for internal structures in the sample, and high acquisition


Search WWH ::

Custom Search