Biomedical Engineering Reference
In-Depth Information
12.5 Biological Applications
12.5.1 Study Malaria-Infected Red Blood Cells
TPM is applied to studying the disease states of malaria-infected RBCs
[26]
. TPM can
quantitatively and noninvasively elucidate the consequences on cell biomechanics of
Plasmodium falciparum
malaria by mapping 3D distributions of refractive index.
The refractive index maps of
Pf
-RBCs show the morphological alterations of host RBCs
and the structures of vacuoles of parasites. In addition, the refractive index is translated into
quantitative information about Hb content of individual
Pf
-RBCs. During the
intraerythrocytic stages of
P. falciparum
, we show the decrease of both the total amount
and the concentration of Hb in the cytoplasm of
Pf
-RBCs.
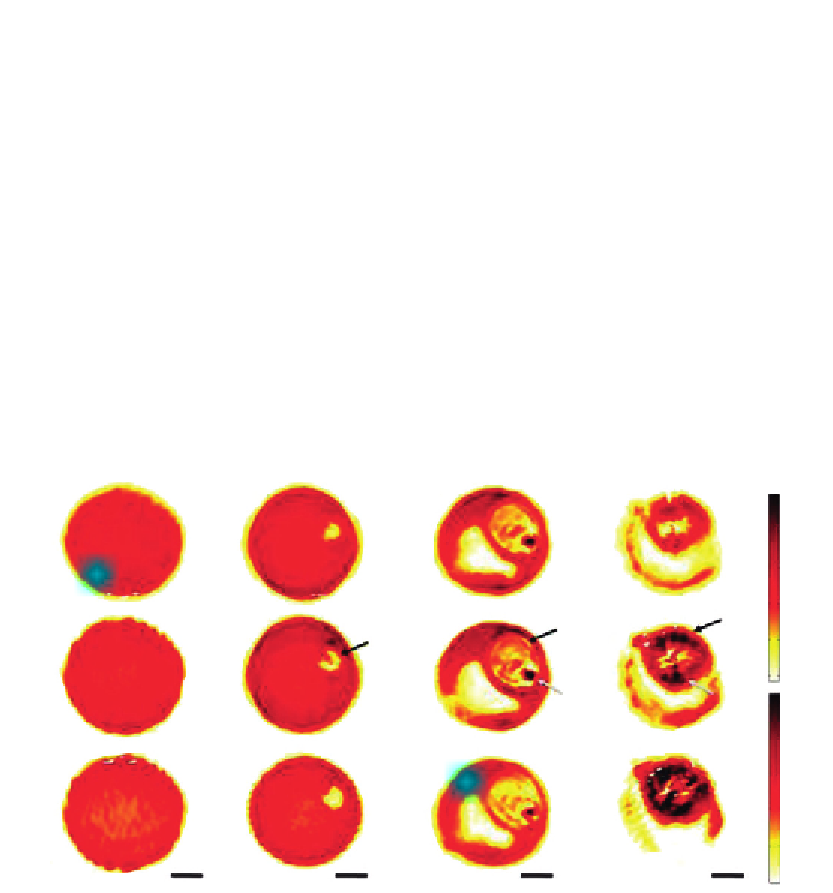
TPM quantitatively provides the 3D distribution of refractive index,
n
(
x
,
y
,
z
). As shown in
Figure 12.14
, the refractive index maps of
Pf
-RBCs is measured during all intraerythrocytic
stages: healthy RBC (
Figure 12.14A
), ring (
Figure 12.14B
), trophozoite (
Figure 12.14C
),
and schizont stage (
Figure 12.14D
). Images in the horizontal rows show refractive index
(A)
(B)
(C)
(D)
1.44
1.42
1.4
z = 0.6
µ
m
1.38
1.36
1.34
500
(Hb)
(g/l)
z=0
µ
m
400
300
200
100
z=-0.6
µ
m
0
Figure 12.14
3D refractive index maps of Pf-RBCs reveal the structural modifications and the hemoglobin
concentration of cytoplasm. (A) Healthy RBC. (B) Ring stage. (C) Trophozoite stage. (D) Schizont
stage. Images in row show three different cross-sections: 0.6
μ
m above the focused plane (top),
m below the focused plane (bottom). Black arrows
indicate the location of P. falciparum, and the gray arrows the location of hemozoin. Color maps
show the refractive index (n) (top right) and the Hb concentration (bottom right). Scale bar,
1.5
at the focused plane (middle), and 0.6
μ
μ
m
[26]
.
Search WWH ::

Custom Search