Biomedical Engineering Reference
In-Depth Information
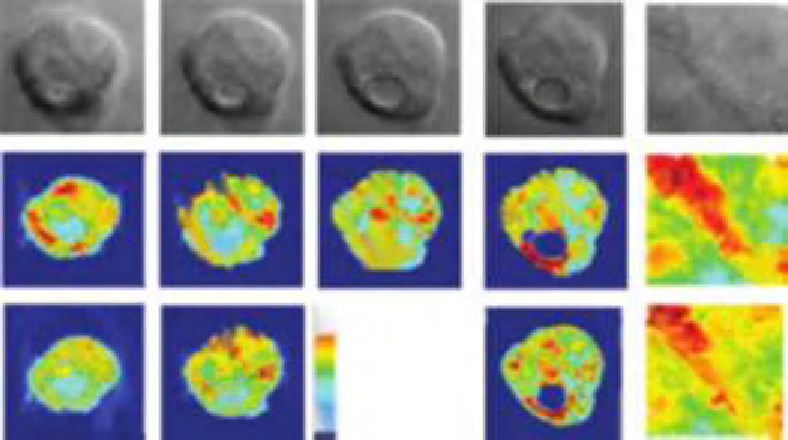
ODT is now applied for imaging live HT29 cells, a human colon adenocarcinoma cell line.
Cells were prepared in an imaging chamber specially designed for the imaging of a live
cell. It is composed of two coverslips separated by a 125
m thick plastic spacer. Cells
were incubated at 37
C for 12 h before the measurements such that they become fully
attached to the coverslip surface. For a fixed objective focus, a set of angular complex
E-field images are taken and applied to both filtered back-projection algorithm and
diffraction tomography based on the Rytov approximation.
μ
Figure 12.9F
y
slices of tomogram images processed by the inverse Radon
transform.
Figure 12.9K
J
are
x
N
are slice images of a tomogram reconstructed by diffraction
tomography based on the Rytov approximation, corresponding to
Figure 12.9F
K
,
respectively.
Figure 12.9H
is the slice corresponding to the objective focus plane, and its
counterpart for ODT is not shown since it is very similar to
Figure 12.9H
.
Figure 12.9G and
L
is the slice image 1.7
μ
μ
m
above the focus, and
Figure 12.9I and M
2.9
μ
m below the focus. The brightfield images
m above the focus,
Figure 12.9F and K
is the slice image 2.9
(A)
(B)
(C)
(D)
(E)
(G)
(F)
(H)
(I)
(J)
(K)
(L)
(M)
(N)
Figure 12.9
Brightfield images (A
E), and 3D tomogram of HT29 cells reconstructed by the filtered back-
projection algorithm (F
J), and diffraction tomography based on the Rytov approximation
(K
N). (H) is the slice image corresponding to the objective focus. (G and L) Slice images 1.7
μ
m
above the original focus, and (F and K) 2.9
μ
m above the focus. (G and K) Slice images 2.9
μ
m
J). (E, J, and N) Zoom-in
images of the rectangular boxes in (B, G, and L), respectively. The color bar indicates refractive
indices at 633 nm wavelength. Scale bar, 10
below the focus. (A
E) Brightfield images at the same foci as (F
μ
m.

Search WWH ::

Custom Search