Biomedical Engineering Reference
In-Depth Information
Next, the performance of the Rytov and Born approximations is compared.
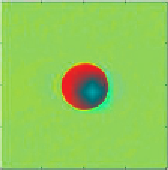
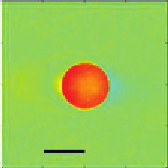
Figure 12.8A
and C
show the slice images of a 6
m bead reconstructed from the Born and Rytov
approximations, respectively. The index in the middle of the bead is lower for the Born
approximation while it is relatively uniform for the Rytov approximation. For a 10
μ
m
bead, distortion inside the bead is even more pronounced for the Born approximation
(
Figure 12.8B
), whereas the refractive index of the slice image of the Rytov approximation
is still uniform. This demonstrates that the validity of the Born approximation is highly
dependent on the size of the object and is not suitable at all for the 10
μ
m polystyrene bead
in oil, whose phase delay is close to 3 rad. This suggests that the Born approximation
cannot be used for imaging a biological cell which typically induces similar phase delay as
a10
μ
m bead. On the other hand, the Rytov approximation is less affected by the object
size and valid for the index difference of 0.03. Thus, the Rytov approximation will be
appropriate for imaging biological cells.
μ
1.62
1.62
1.6
1.6
1.6
1.58
1.58
1.58
1.56
1.56
1.56
1.54
1.54
1.54
1.5
-10
1.52
1.52
-5
0
5 0
-15
-10
-5
0
51015
x
(micron)
x
(micron)
(A)
(B)
1.62
1.62
1.6
1.6
1.58
1.58
1.56
1.56
1.54
1.54
1.52
1.5
-10
-15
-10
-5 0
x
(micron)
51015
-5 0
x
(micron)
5 0
(C)
(D)
Figure 12.8
Comparison of the Born and Rytov approximations in diffraction tomography. (A and C) Slice
images of a 6
m bead reconstructed based on the Born and Rytov approximations, respectively.
Line profiles across the center of the bead are presented next to the slice images. (B and D) Same
as (A and C) for a 10
μ
μ
m bead. The color bar indicates refractive indices at 633 nm wavelength
[24]
.


Search WWH ::

Custom Search