Biomedical Engineering Reference
In-Depth Information
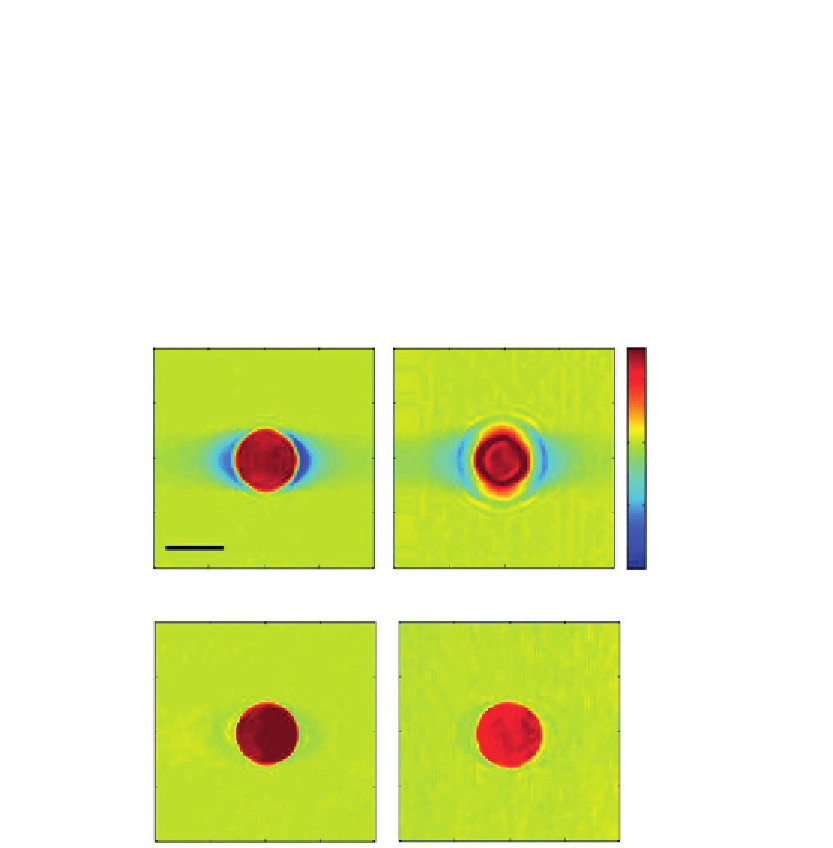
middle of the bead presented ring patterns (
Figure 12.7B
), which are due to diffraction of
the propagating beam. This suggests that the inverse Radon transform be subject to the
error in the reconstruction due to its inability to take the effect of diffraction into account.
On the other hand, ODT based on the Rytov approximation is free from this artifact.
Slice images of tomograms reconstructed by ODT are shown in
Figure 12.7C and D
at the
objective focus in the middle of the bead and 4
m above the center of the bead,
respectively. Both images show clear boundaries of the bead with uniform index
distributions. This indicates that the diffraction tomography properly accounts for the
effects of diffraction. Note that the index of the bead relative to that of the oil is set to 0.03.
This difference is very close to the relative index of the cell to the culture medium.
Hence, the Rytov approximation is expected to be applicable to imaging of single cells.
μ
1.58
1.56
1.54
1.52
(A)
(B)
(C)
(D)
Figure 12.7
Comparison between filtered back-projection algorithm and diffraction tomography with the
Rytov approximation. (A and B) Slice images of tomogram in the middle of a 6
m bead
reconstructed by the filtered back-projection algorithm when the objective focus is in the middle
of the bead (A) and 4
μ
m above the center of the bead (B). (C and D) Same slice images as
(A and B) after reconstructed by the diffraction tomography based on the Rytov approximation at
objective focus in the middle of the bead (C) and 4
μ
m above the center of the bead (D).
The color bar indicates refractive indices at 633 nm wavelength. Scale bar, 5
μ
m
[24]
.
(For interpretation of the references to color in this figure legend, the reader is referred to the
web version of this topic.)
μ
Search WWH ::

Custom Search