Biomedical Engineering Reference
In-Depth Information
Radon transform is applied to every
X
slice in the beam rotation direction, with
X
the
coordinate in the tilt direction. To compensate for the angle between imaging and
illumination directions, the
X
values are divided by cos
θ
θ
(Figure 12.2
).
To validate the instrument's measurements, refractive index tomograms are measured for
10
λ
5
633 nm) immersed in oil
with a slightly smaller refractive index (Cargille #18095,
n
5
1.559 at
μ
m polystyrene beads (Polysciences #17136,
n
5
1.588 at
λ
5
633 nm).
Tomograms showed a constant refractive index inside each bead, and the refractive index
difference between the bead and its surroundings was
n
5
0.0285
6
0.0005, in agreement
with the manufacturers' specifications for beads and oil (
Δ
n
5
0.029). Similar tests with a
range of oil refractive indices from
n
5
1.55 to
n
5
1.59 also gave good agreement.
By measuring the full width at half maximum (FWHM) of the derivative of line profiles of
refractive index normal to the boundary of the sphere, the spatial resolution of the
Δ
(A)
z
θ
y
x
Sample
Coverslip
φ
θ
= 0°
φ
θ
= 45°
(B)
(C)
X
X
8
(E)
(D)
6
y
=
y
0
4
2
0
X
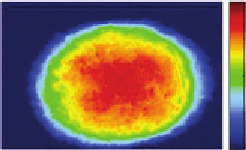
Figure 12.2
(A) Illumination geometry and projection on xz plane. Blue lines represent the illumination at
zero degrees and red lines at angle
θ
. (B and C) Projection phase line profiles of a HeLa cell at
0
and 45
, respectively, at fixed y
5
y
0
. (D and E) Projection phase images corresponding to
(B and C), respectively. The color bar indicates the phase in radian. Scale bar, 10
θ
5
m
[13]
.
(For interpretation of the references to color in this figure legend, the reader is referred to the
web version of this topic.)
μ


Search WWH ::

Custom Search