Biomedical Engineering Reference
In-Depth Information
Osmolarity and pH
Transient
regulatory
response
Transient
regulatory
response
Condition
applied
Condition
applied
154 Osm
428 Osm
pH 6
pH 8
5
0.5
0.05
0.005
0
6
Time (h)
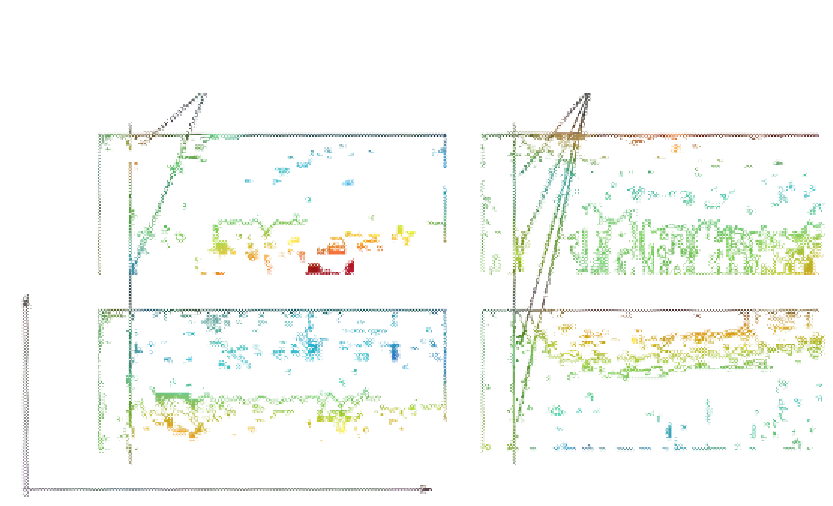
Figure 11.10
Differential spectrograms of hypo- and hypertonic conditions compared with acidic and alkaline
conditions. The volumetric regulatory response in 154 Osm data is missing in the pH 6 data.
mathematical algorithms for feature extraction, these spectrogram fingerprints can be coded
into unique feature vectors for different drugs, allowing a comparison of drug mechanism
of action among known drugs and for comparison to new uncharacterized drug compounds.
This approach to drug screening is novel and is compatible with high-content and high-
throughput screening and is the subject of our ongoing research.
In conclusion, we have shown how to use motions inside live cells and tissues as
endogenous contrast for functional imaging. The motions are captured through the
effect on DLS that causes fluctuating speckle fields. Different types of motion have
different characteristic time scales that allow the separation of different mechanisms
into separate frequency bands. In general, small organelles have high-frequency
signatures (1
1 Hz),
and slow cell shape changes and tissue rearrangements have low-frequency signatures
(0.01
10 Hz), membrane undulations have midfrequency signatures (0.1
0.1 Hz). The time development of the spectral power in the fluctuating speckle
in response to applied environmental perturbations or drugs is captured in differential
drug response spectrograms. Different drugs have different spectrogram signatures
which might be useful for early drug discovery applications.


Search WWH ::

Custom Search